
Discover today’s performance of BLOM indices, the closing prices of Lebanese stocks and Eurobonds, as well as the exchange rate of major currencies against the LBP.
BLOM Stock Index (BSI) – today’s performance
| Last | Previous | % Change | Y-t-D Change | |
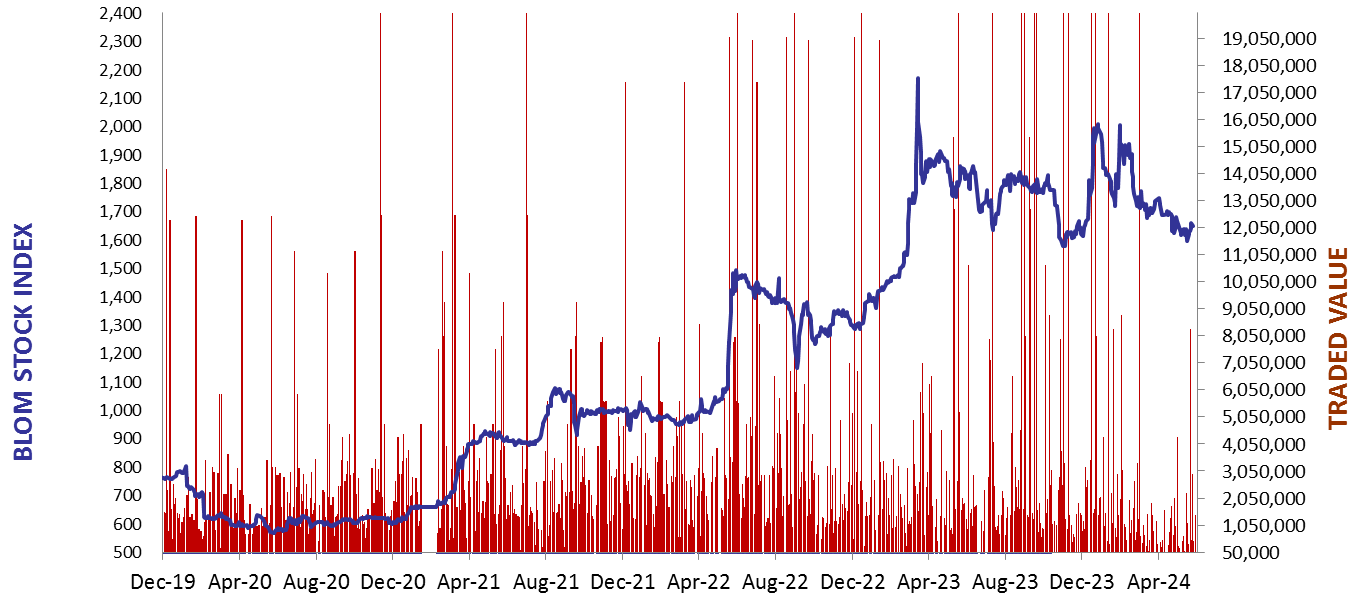
| BSI | 1,652.66 | 1,650.59 | 0.13% | -16.24% |
| High | 1,742.50 | 1,669.40 | ||
| Low | 1,652.66 | 1,644.58 | ||
| Volume | 47,618 | 62,289 | ||
| Val ($) | 2,584,049 | 1,408,663 |
I): BLOM preferred Shares Index (BPSI): today’s Performance
| Last | Previous | Change | |
| BPSI | 35.15 | 35.15 | 0.00% |
| Volume | |||
| Value |
Lebanese Stocks: today’s Trades and Closing Prices
| Last Price ($) | % Change | Volume | VWAP ($) | |
| Solidere A | 69.70 | -0.43% | 19,918 | 69.87 |
| Solidere B | 68.10 | 0.15% | 3,100 | 68.10 |
| Byblos Listed shares | 0.66 | 1.54% | 9,600 | 0.7 |
| HOLCIM | 65.00 | 3.17% | 15,000 | 65.0 |
Closing Date: May 28, 2024
The BLOM Stock Index
BLOM BOND INDEX: Last Session’s Performance
| Last | Previous | Change | Y-t-D Change | ||
| BBI | 6.34 | 6.33 | 0.14% | 5.17% | |
| Weighted Yield | 234.72% | 232.27% | 245 | bps | |
| Duration (Years) | 1.33 | 1.34 | |||
| 5Y Bond Yield | 103.60% | 103.70% | -10 | bps | |
| 5Y Spread* | 9,839 | 9,849 | -10 | bps | |
| 10Y Bond Yield | 100.80% | 101.05% | -25 | bps | |
| 10Y Spread* | 9,609 | 9,634 | -25 | bps |
*spread between Lebanese Eurobonds and US Treasuries
| Price | Yield | Yield Change | |
| 26/02/2025 | 7.00 | 978.68% | 2,028 |
| 12/06/2025 | 7.19 | 552.84% | 923 |
| 28/11/2026 | 7.00 | 188.04% | 73 |
| 23/03/2027 | 7.00 | 166.85% | 32 |
| 29/11/2027 | 7.00 | 141.46% | 34 |
| 03/11/2028 | 7.00 | 119.09% | (8) |
| 26/02/2030 | 7.01 | 103.71% | (18) |
| 22/04/2031 | 7.00 | 102.86% | (30) |
| 23/03/2032 | 7.02 | 99.86% | (31) |
| 02/11/2035 | 7.00 | 99.69% | (26) |
| 23/03/2037 | 7.01 | 101.08% | (26) |
Closing Date: May 27, 2024
Lebanese Forex Market
| Last Price | Previous | % Change | |
| $/LBP | 89,500 | 89,500 | – |
| €/LBP | 97,322.30 | 97,188.05 | 0.14% |
| £/LBP | 114,318.35 | 114,282.55 | 0.03% |
| NEER | 226.94 | 227.08 | -0.06% |
Closing Date: May 28, 2024