
Discover today’s performance of BLOM indices, the closing prices of Lebanese stocks and Eurobonds, as well as the exchange rate of major currencies against the LBP.
BLOM Stock Index (BSI) – today’s performance
| Last | Previous | % Change | Y-t-D Change | |
| BSI | 1,668.83 | 1,654.46 | 0.87% | -15.42% |
| High | 1,674.58 | 1,672.58 | ||
| Low | 1,662.33 | 1,650.69 | ||
| Volume | 26,201 | 6,849 | ||
| Val ($) | 1,835,440 | 473,830 |
I): BLOM preferred Shares Index (BPSI): today’s Performance
| Last | Previous | Change | |
| BPSI | 35.15 | 35.15 | 0.00% |
| Volume | |||
| Value |
Lebanese Stocks: today’s Trades and Closing Prices
| Last Price ($) | % Change | Volume | VWAP ($) | |
| Solidere A | 70.05 | 1.52% | 25,557 | 70.06 |
| Solidere B | 69.70 | 0.94% | 644 | 69.71 |
Closing Date: May 31, 2024
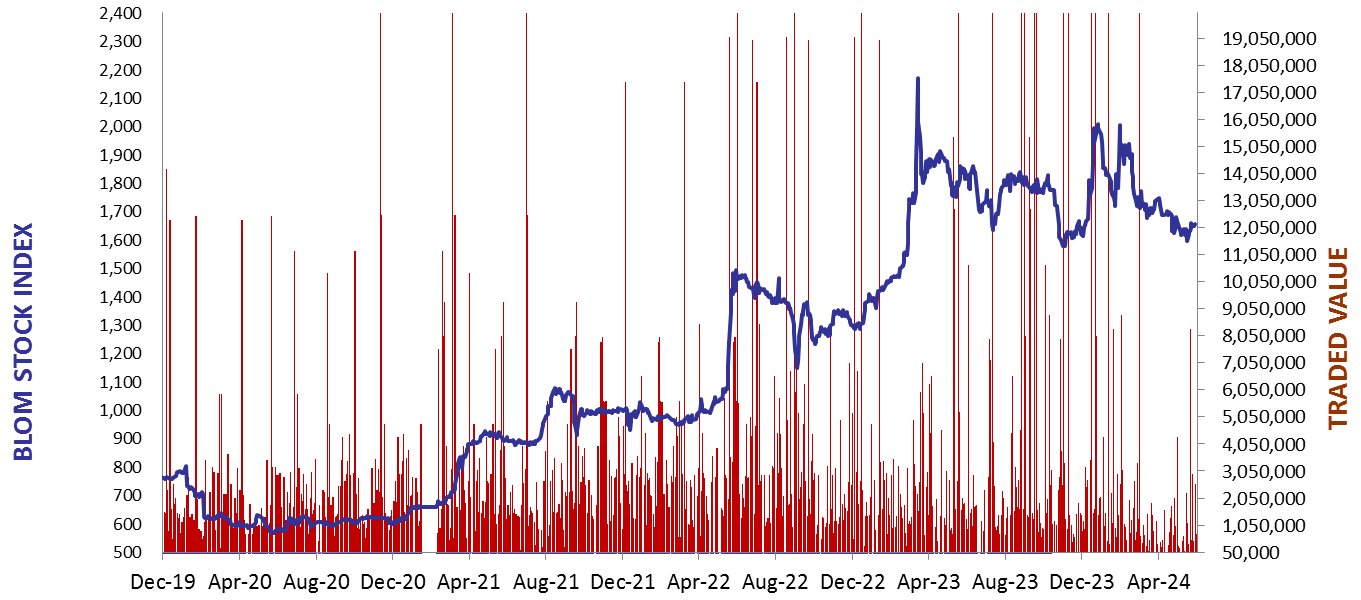
The BLOM Stock Index
BLOM BOND INDEX: Last Session’s Performance
| Last | Previous | Change | Y-t-D Change | ||
| BBI | 6.35 | 6.36 | -0.01% | 5.37% | |
| Weighted Yield | 236.99% | 236.19% | 80 | bps | |
| Duration (Years) | 1.48 | 1.48 | |||
| 5Y Bond Yield | 103.55% | 103.55% | 0 | bps | |
| 5Y Spread* | 9,836 | 9,833 | 3 | bps | |
| 10Y Bond Yield | 100.45% | 100.55% | -10 | bps | |
| 10Y Spread* | 9,571 | 9,576 | -5 | bps |
*spread between Lebanese Eurobonds and US Treasuries
| Price | Yield | Yield Change | |
| 26/02/2025 | 7.02 | 998.02% | 630 |
| 12/06/2025 | 7.19 | 562.00% | 282 |
| 28/11/2026 | 7.02 | 188.30% | 63 |
| 23/03/2027 | 7.01 | 167.02% | 20 |
| 29/11/2027 | 7.04 | 141.32% | (33) |
| 03/11/2028 | 7.02 | 118.92% | (19) |
| 26/02/2030 | 7.01 | 103.70% | 4 |
| 22/04/2031 | 6.97 | 103.17% | 35 |
| 23/03/2032 | 7.04 | 99.59% | (11) |
| 02/11/2035 | 7.02 | 99.29% | (9) |
| 23/03/2037 | 7.01 | 101.02% | (15) |
Closing Date: May 30, 2024
Lebanese Forex Market
| Last Price | Previous | % Change | |
| $/LBP | 89,500 | 89,500 | – |
| €/LBP | 96,874.80 | 96,946.40 | -0.07% |
| £/LBP | 113,727.65 | 113,951.40 | -0.20% |
| NEER | 227.43 | 227.40 | 0.02% |
Closing Date: May 31, 2024