
Discover today’s performance of BLOM indices, the closing prices of Lebanese stocks and Eurobonds, as well as the exchange rate of major currencies against the LBP.
BLOM Stock Index (BSI) – today’s performance
| Last | Previous | % Change | Y-t-D Change | |
| BSI | 1,657.53 | 1,660.14 | -0.16% | -15.99% |
| High | 1,665.25 | 1,680.15 | ||
| Low | 1,654.34 | 1,660.14 | ||
| Volume | 6,350 | 96,902 | ||
| Val ($) | 442,648 | 1,400,699 |
I): BLOM preferred Shares Index (BPSI): today’s Performance
| Last | Previous | Change | |
| BPSI | 35.15 | 35.15 | 0.00% |
| Volume | |||
| Value |
Lebanese Stocks: today’s Trades and Closing Prices
| Last Price ($) | % Change | Volume | VWAP ($) | |
| Solidere A | 69.70 | -0.43% | 6,100 | 69.71 |
| Solidere B | 69.75 | 0.07% | 250 | 69.75 |
Closing Date: June 06, 2024
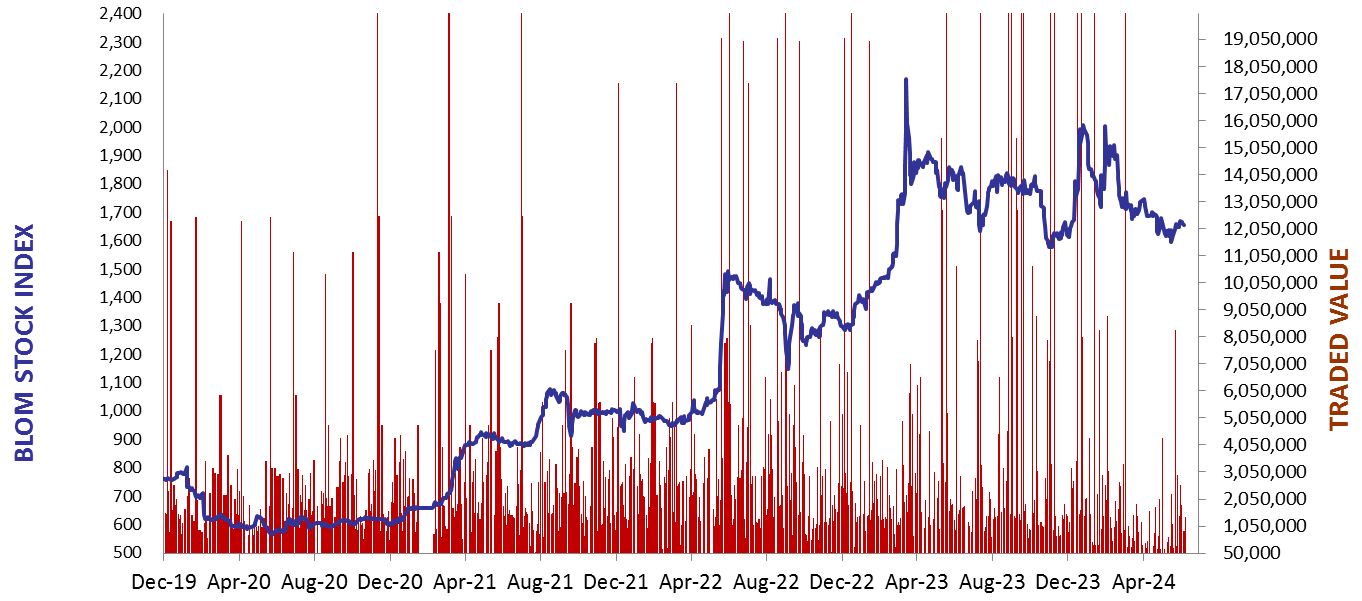
The BLOM Stock Index
BLOM BOND INDEX: Last Session’s Performance
| Last | Previous | Change | Y-t-D Change | ||
| BBI | 6.47 | 6.49 | -0.17% | 7.36% | |
| Weighted Yield | 238.41% | 236.99% | 142 | bps | |
| Duration (Years) | 1.48 | 1.48 | |||
| 5Y Bond Yield | 102.00% | 102.00% | 0 | bps | |
| 5Y Spread* | 9,692 | 9,689 | 3 | bps | |
| 10Y Bond Yield | 98.70% | 99.00% | -30 | bps | |
| 10Y Spread* | 9,420 | 9,445 | -25 | bps |
*spread between Lebanese Eurobonds and US Treasuries
| Price | Yield | Yield Change | |
| 26/02/2025 | 7.16 | 1020.29% | 374 |
| 12/06/2025 | 7.27 | 573.73% | 431 |
| 28/11/2026 | 7.16 | 186.73% | (125) |
| 23/03/2027 | 7.16 | 165.69% | (128) |
| 29/11/2027 | 7.16 | 139.97% | (130) |
| 03/11/2028 | 7.17 | 117.32% | (132) |
| 26/02/2030 | 7.17 | 102.17% | (136) |
| 22/04/2031 | 7.06 | 101.99% | (33) |
| 23/03/2032 | 7.16 | 98.08% | (139) |
| 02/11/2035 | 7.14 | 97.58% | (153) |
| 23/03/2037 | 7.17 | 98.75% | (120) |
Closing Date: June 05, 2024
Lebanese Forex Market
| Last Price | Previous | % Change | |
| $/LBP | 89,500 | 89,500 | – |
| €/LBP | 97,384.95 | 97,268.60 | 0.12% |
| £/LBP | 114,479.45 | 114,425.75 | 0.05% |
| NEER | 227.17 | 227.77 | -0.26% |
Closing Date: June 06, 2024