
Discover today’s performance of BLOM indices, the closing prices of Lebanese stocks and Eurobonds, as well as the exchange rate of major currencies against the LBP.
BLOM Stock Index (BSI) – today’s performance
| Last | Previous | % Change | Y-t-D Change | |
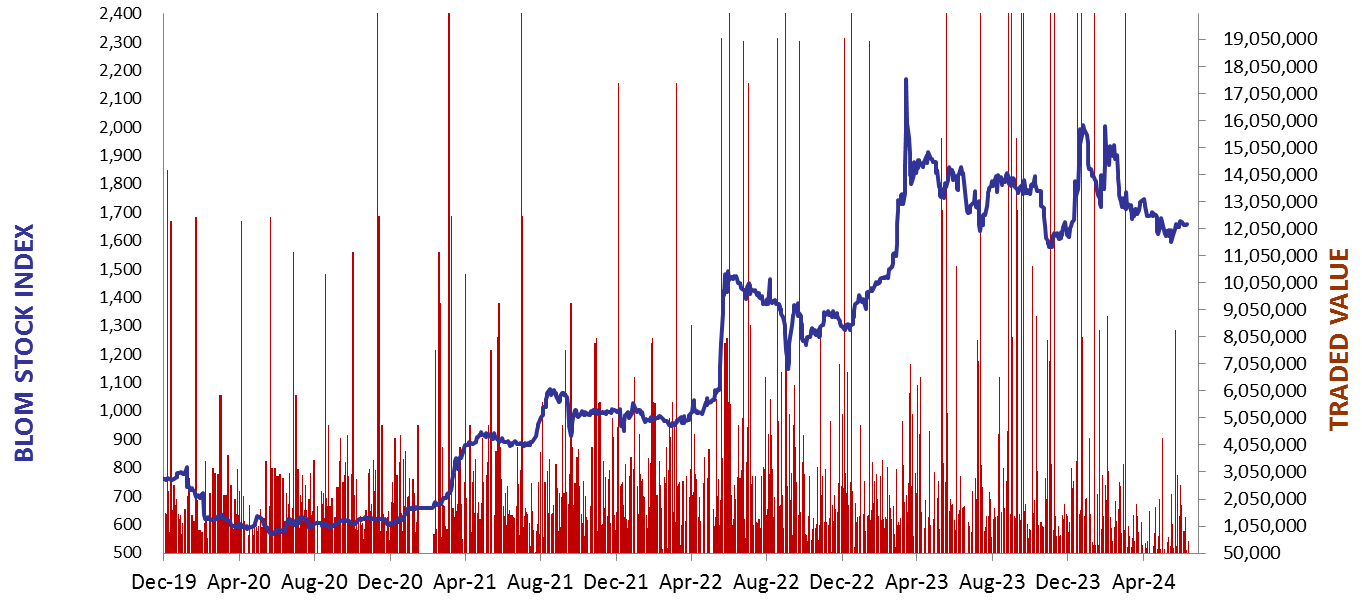
| BSI | 1,658.36 | 1,656.73 | 0.10% | -15.95% |
| High | 1,661.22 | 1,660.37 | ||
| Low | 1,651.69 | 1,642.44 | ||
| Volume | 6,939 | 21,159 | ||
| Val ($) | 484,390 | 405,613 |
I): BLOM preferred Shares Index (BPSI): today’s Performance
| Last | Previous | Change | |
| BPSI | 35.15 | 35.15 | 0.00% |
| Volume | |||
| Value |
Lebanese Stocks: today’s Trades and Closing Prices
| Last Price ($) | % Change | Volume | VWAP ($) | |
| Solidere A | 69.90 | 0.29% | 6,914 | 69.81 |
| Solidere B | 69.50 | -0.07% | 25 | 69.50 |
Closing Date: June 11, 2024
The BLOM Stock Index
BLOM BOND INDEX: Last Session’s Performance
| Last | Previous | Change | Y-t-D Change | ||
| BBI | 6.34 | 6.37 | -0.51% | 5.07% | |
| Weighted Yield | 246.71% | 242.84% | 388 | bps | |
| Duration (Years) | 1.44 | 1.46 | |||
| 5Y Bond Yield | 104.00% | 103.30% | 70 | bps | |
| 5Y Spread* | 9,884 | 9,813 | 71 | bps | |
| 10Y Bond Yield | 100.80% | 100.40% | 40 | bps | |
| 10Y Spread* | 9,618 | 9,575 | 43 | bps |
*spread between Lebanese Eurobonds and US Treasuries
| Price | Yield | Yield Change | |
| 26/02/2025 | 7.00 | 1077.86% | 3,010 |
| 12/06/2025 | 7.17 | 595.97% | 1,168 |
| 28/11/2026 | 7.00 | 189.86% | 134 |
| 23/03/2027 | 7.00 | 168.49% | 63 |
| 29/11/2027 | 7.00 | 142.10% | 40 |
| 03/11/2028 | 7.00 | 119.26% | 35 |
| 26/02/2030 | 7.01 | 104.00% | 36 |
| 22/04/2031 | 6.89 | 103.94% | 155 |
| 23/03/2032 | 7.00 | 99.96% | 37 |
| 02/11/2035 | 7.00 | 99.24% | 41 |
| 23/03/2037 | 7.01 | 100.85% | 32 |
Closing Date: June 10, 2024
Lebanese Forex Market
| Last Price | Previous | % Change | |
| $/LBP | 89,500 | 89,500 | – |
| €/LBP | 96,355.70 | 96,328.85 | 0.03% |
| £/LBP | 113,897.70 | 113,933.50 | -0.03% |
| NEER | 227.42 | 227.60 | -0.08% |
Closing Date: June 11, 2024