
Discover today’s performance of BLOM indices, the closing prices of Lebanese stocks and Eurobonds, as well as the exchange rate of major currencies against the LBP.
BLOM Stock Index (BSI) – today’s performance
| Last | Previous | % Change | Y-t-D Change | |
| BSI | 1,651.51 | 1,656.46 | -0.30% | -16.29% |
| High | 1,672.92 | 1,659.92 | ||
| Low | 1,648.36 | 1,652.39 | ||
| Volume | 16,790 | 11,463 | ||
| Val ($) | 948,787 | 800,419 |
I): BLOM preferred Shares Index (BPSI): today’s Performance
| Last | Previous | Change | |
| BPSI | 35.15 | 35.15 | 0.00% |
| Volume | |||
| Value |
Lebanese Stocks: today’s Trades and Closing Prices
| Last Price ($) | % Change | Volume | VWAP ($) | |
| Solidere A | 69.55 | -0.50% | 12,740 | 69.83 |
| Solidere B | 69.05 | -0.22% | 700 | 69.05 |
| BLOM GDR | 3.24 | -2.41% | 3,350 | 3.2 |
Closing Date: June 13, 2024
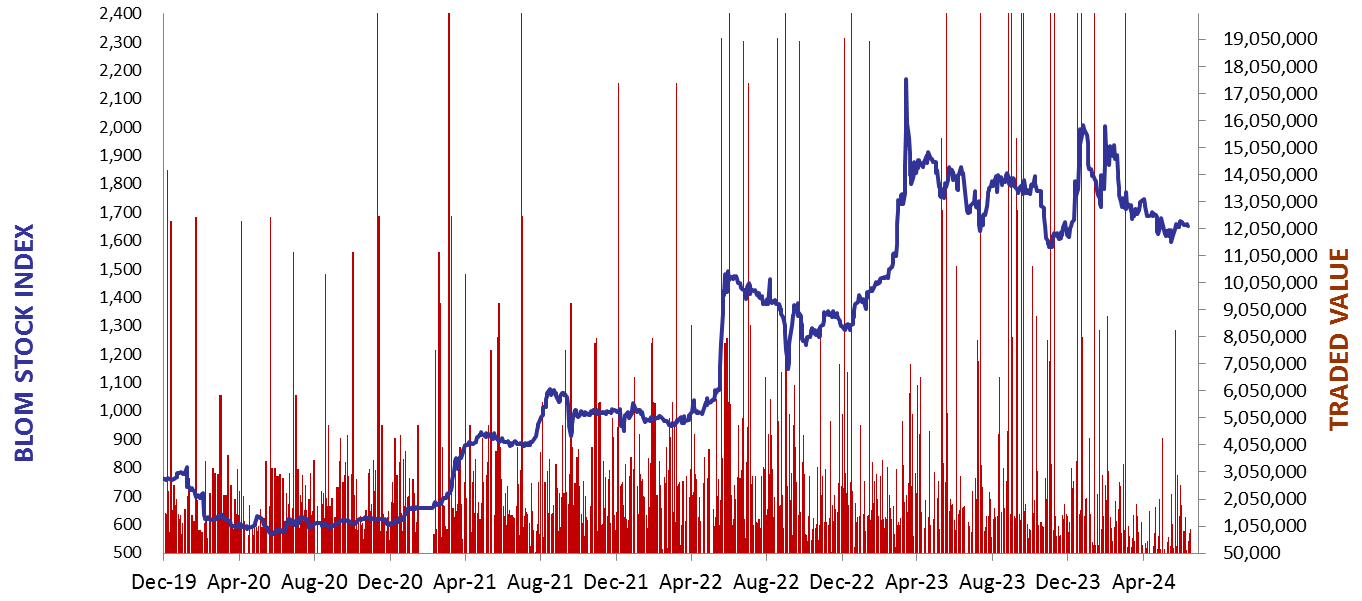
The BLOM Stock Index
BLOM BOND INDEX: Last Session’s Performance
| Last | Previous | Change | Y-t-D Change | ||
| BBI | 6.35 | 6.35 | -0.05% | 5.25% | |
| Weighted Yield | 248.52% | 247.42% | 110 | bps | |
| Duration (Years) | 1.46 | 1.44 | |||
| 5Y Bond Yield | 103.80% | 103.80% | 0 | bps | |
| 5Y Spread* | 9,867 | 9,863 | 4 | bps | |
| 10Y Bond Yield | 100.70% | 100.50% | 20 | bps | |
| 10Y Spread* | 9,622 | 9,593 | 29 | bps |
*spread between Lebanese Eurobonds and US Treasuries
| Price | Yield | Yield Change | |
| 26/02/2025 | 7.00 | 1095.05% | 972 |
| 12/06/2025 | 7.19 | 602.15% | 300 |
| 28/11/2026 | 7.03 | 189.74% | 4 |
| 23/03/2027 | 7.00 | 168.76% | 14 |
| 29/11/2027 | 7.00 | 142.17% | 4 |
| 03/11/2028 | 7.00 | 119.25% | 18 |
| 26/02/2030 | 7.02 | 103.94% | 11 |
| 22/04/2031 | 7.00 | 102.59% | (1) |
| 23/03/2032 | 7.00 | 99.93% | 21 |
| 02/11/2035 | 7.01 | 99.03% | 7 |
| 23/03/2037 | 7.03 | 100.67% | 10 |
Closing Date: June 12, 2024
Lebanese Forex Market
| Last Price | Previous | % Change | |
| $/LBP | 89,500 | 89,500 | – |
| €/LBP | 96,704.75 | 96,722.65 | -0.02% |
| £/LBP | 114,381.00 | 114,524.20 | -0.13% |
| NEER | 227.39 | 227.44 | -0.02% |
Closing Date: June 13, 2024