
Discover today’s performance of BLOM indices, the closing prices of Lebanese stocks and Eurobonds, as well as the exchange rate of major currencies against the LBP.
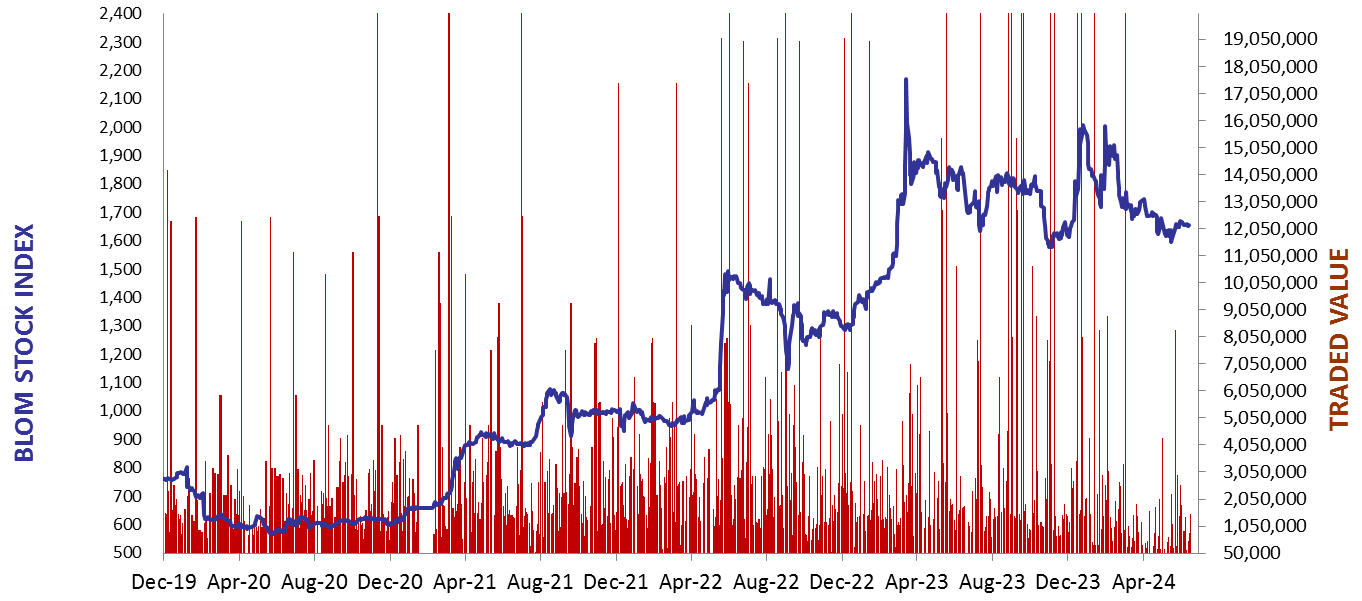
BLOM Stock Index (BSI) – today’s performance
| Last | Previous | % Change | Y-t-D Change | |
| BSI | 1,657.62 | 1,651.51 | 0.37% | -15.98% |
| High | 1,662.58 | 1,672.92 | ||
| Low | 1,651.51 | 1,648.36 | ||
| Volume | 22,096 | 16,790 | ||
| Val ($) | 1,511,547 | 948,787 |
I): BLOM preferred Shares Index (BPSI): today’s Performance
| Last | Previous | Change | |
| BPSI | 35.15 | 35.15 | 0.00% |
| Volume | |||
| Value |
Lebanese Stocks: today’s Trades and Closing Prices
| Last Price ($) | % Change | Volume | VWAP ($) | |
| Solidere A | 70.00 | 0.65% | 17,000 | 70.05 |
| HOLCIM | 62.95 | 1.45% | 5,096 | 62.90 |
Closing Date: June 14, 2024
The BLOM Stock Index
BLOM BOND INDEX: Last Session’s Performance
| Last | Previous | Change | Y-t-D Change | ||
| BBI | 6.34 | 6.35 | -0.07% | 5.18% | |
| Weighted Yield | 249.35% | 248.52% | 83 | bps | |
| Duration (Years) | 1.46 | 1.46 | |||
| 5Y Bond Yield | 103.85% | 103.80% | 5 | bps | |
| 5Y Spread* | 9,878 | 9,867 | 11 | bps | |
| 10Y Bond Yield | 100.75% | 100.70% | 5 | bps | |
| 10Y Spread* | 9,633 | 9,622 | 11 | bps |
*spread between Lebanese Eurobonds and US Treasuries
| Price | Yield | Yield Change | |
| 26/02/2025 | 7.02 | 1101.38% | 633 |
| 12/06/2025 | 7.19 | 604.41% | 226 |
| 28/11/2026 | 7.00 | 190.27% | 53 |
| 23/03/2027 | 7.00 | 168.90% | 14 |
| 29/11/2027 | 7.00 | 142.20% | 4 |
| 03/11/2028 | 7.00 | 119.31% | 6 |
| 26/02/2030 | 7.01 | 104.02% | 8 |
| 22/04/2031 | 7.00 | 102.58% | (1) |
| 23/03/2032 | 7.00 | 99.95% | 2 |
| 02/11/2035 | 7.00 | 99.15% | 12 |
| 23/03/2037 | 7.02 | 100.79% | 13 |
Closing Date: June 13, 2024
Lebanese Forex Market
| Last Price | Previous | % Change | |
| $/LBP | 89,500 | 89,500 | – |
| €/LBP | 95,675.50 | 96,078.25 | -0.42% |
| £/LBP | 114,094.60 | 114,193.05 | -0.09% |
| NEER | 227.67 | 227.39 | 0.12% |
Closing Date: June 14, 2024