
Discover today’s performance of BLOM indices, the closing prices of Lebanese stocks and Eurobonds, as well as the exchange rate of major currencies against the LBP.
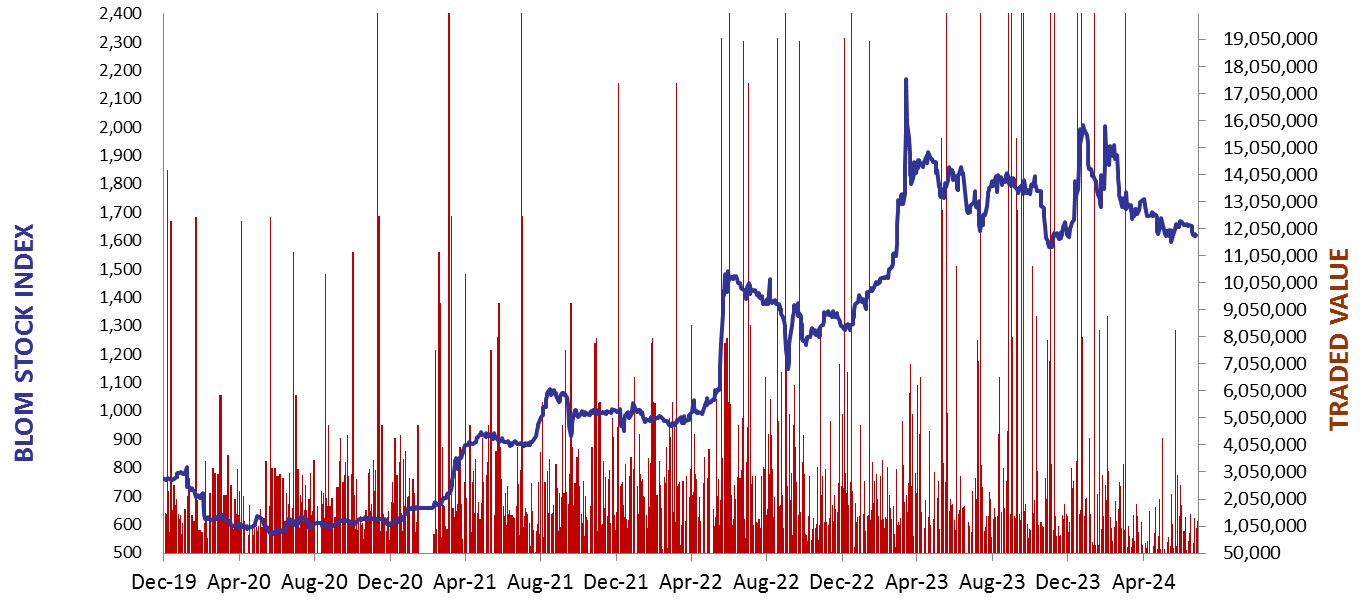
BLOM Stock Index (BSI) – today’s performance
| Last | Previous | % Change | Y-t-D Change | |
| BSI | 1,620.79 | 1,618.80 | 0.12% | -17.85% |
| High | 1,622.69 | 1,628.33 | ||
| Low | 1,618.80 | 1,614.58 | ||
| Volume | 37,927 | 30,897 | ||
| Val ($) | 2,228,307 | 1,218,789 |
I): BLOM preferred Shares Index (BPSI): today’s Performance
| Last | Previous | Change | |
| BPSI | 35.15 | 35.15 | 0.00% |
| Volume | |||
| Value |
Lebanese Stocks: today’s Trades and Closing Prices
| Last Price ($) | % Change | Volume | VWAP ($) | |
| Solidere A | 69.95 | 0.43% | 22,691 | 69.85 |
| Solidere B | 69.25 | 0.29% | 9,236 | 69.26 |
| Byblos Bank – Listed Shares | 0.60 | -6.25% | 6,000 | 0.60 |
Closing Date: June 26, 2024
The BLOM Stock Index
BLOM BOND INDEX: Last Session’s Performance
| Last | Previous | Change | Y-t-D Change | ||
| BBI | 6.26 | 6.24 | 0.33% | 3.86% | |
| Weighted Yield | 264.19% | 263.76% | 43 | bps | |
| Duration (Years) | 1.41 | 1.41 | |||
| 5Y Bond Yield | 105.20% | 105.40% | -20 | bps | |
| 5Y Spread* | 10,010 | 10,030 | -20 | bps | |
| 10Y Bond Yield | 101.75% | 102.20% | -45 | bps | |
| 10Y Spread* | 9,730 | 9,774 | -44 | bps |
*spread between Lebanese Eurobonds and US Treasuries
| Price | Yield | Yield Change | |
| 26/02/2025 | 6.92 | 1233.39% | 557 |
| 12/06/2025 | 7.11 | 638.62% | 232 |
| 28/11/2026 | 6.91 | 193.41% | 1 |
| 23/03/2027 | 6.92 | 171.81% | 10 |
| 29/11/2027 | 6.90 | 143.98% | (5) |
| 03/11/2028 | 6.91 | 120.55% | (28) |
| 26/02/2030 | 6.90 | 105.67% | (16) |
| 22/04/2031 | 6.87 | 104.07% | (71) |
| 23/03/2032 | 6.92 | 100.99% | (57) |
| 02/11/2035 | 6.92 | 99.88% | (45) |
| 23/03/2037 | 7.00 | 100.95% | (96) |
Closing Date: June 25, 2024
Lebanese Forex Market
| Last Price | Previous | % Change | |
| $/LBP | 89,500 | 89,500 | – |
| €/LBP | 95,765.00 | 95,881.35 | -0.12% |
| £/LBP | 113,494.95 | 113,512.85 | -0.02% |
| NEER | 228.21 | 228.22 | 0.00% |
Closing Date: June 26, 2024