
Discover today’s performance of BLOM indices, the closing prices of Lebanese stocks and Eurobonds, as well as the exchange rate of major currencies against the LBP.
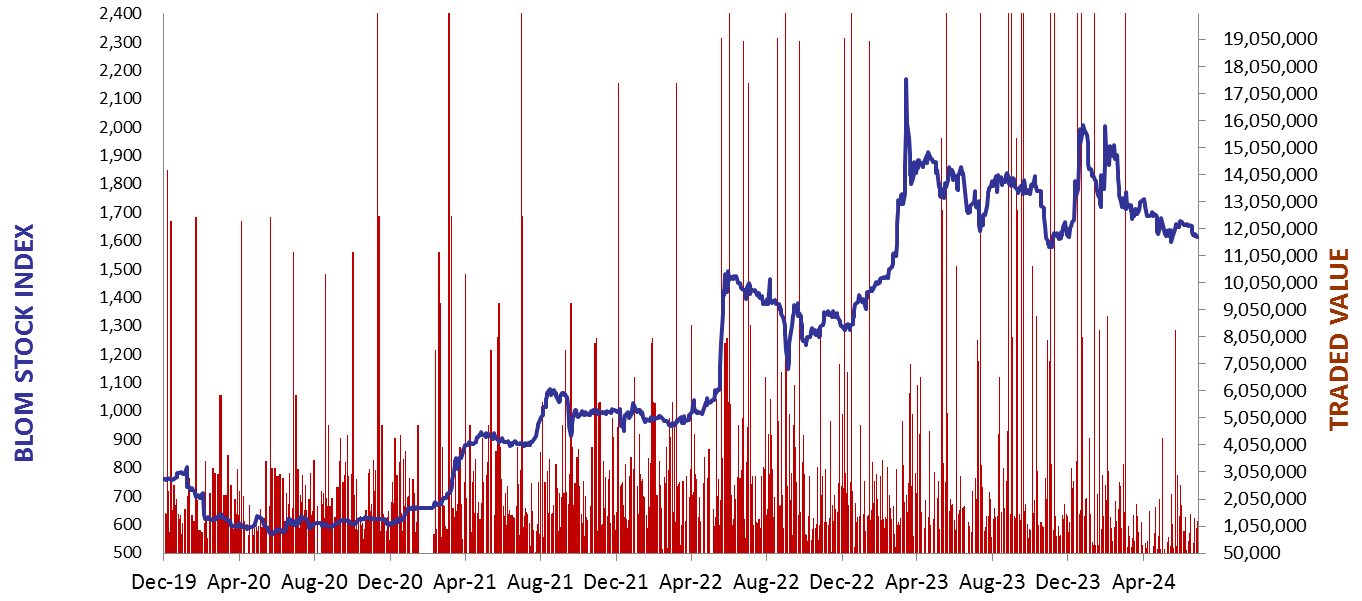
BLOM Stock Index (BSI) – today’s performance
| Last | Previous | % Change | Y-t-D Change | |
| BSI | 1,614.51 | 1,620.79 | -0.39% | -18.17% |
| High | 1,630.97 | 1,622.69 | ||
| Low | 1,612.72 | 1,618.80 | ||
| Volume | 28,681 | 37,927 | ||
| Val ($) | 1,573,586 | 2,228,307 |
I): BLOM preferred Shares Index (BPSI): today’s Performance
| Last | Previous | Change | |
| BPSI | 35.15 | 35.15 | 0.00% |
| Volume | |||
| Value |
Lebanese Stocks: today’s Trades and Closing Prices
| Last Price ($) | % Change | Volume | VWAP ($) | |
| Solidere A | 69.30 | -0.93% | 13,061 | 69.36 |
| Solidere B | 69.00 | -0.36% | 9,620 | 69.01 |
| Byblos Bank – Listed Shares | 0.63 | 5.00% | 6,000 | 0.60 |
Closing Date: June 27, 2024
The BLOM Stock Index
BLOM BOND INDEX: Last Session’s Performance
| Last | Previous | Change | Y-t-D Change | ||
| BBI | 6.23 | 6.26 | -0.57% | 3.27% | |
| Weighted Yield | 266.23% | 264.19% | 205 | bps | |
| Duration (Years) | 1.40 | 1.41 | |||
| 5Y Bond Yield | 105.80% | 105.20% | 60 | bps | |
| 5Y Spread* | 10,067 | 10,010 | 57 | bps | |
| 10Y Bond Yield | 102.60% | 101.75% | 85 | bps | |
| 10Y Spread* | 9,807 | 9,730 | 77 | bps |
*spread between Lebanese Eurobonds and US Treasuries
| Price | Yield | Yield Change | |
| 26/02/2025 | 6.89 | 1249.52% | 1,613 |
| 12/06/2025 | 7.11 | 641.09% | 247 |
| 28/11/2026 | 6.86 | 194.44% | 103 |
| 23/03/2027 | 6.90 | 172.24% | 42 |
| 29/11/2027 | 6.89 | 144.14% | 16 |
| 03/11/2028 | 6.84 | 121.36% | 81 |
| 26/02/2030 | 6.88 | 105.86% | 19 |
| 22/04/2031 | 6.79 | 105.03% | 96 |
| 23/03/2032 | 6.84 | 102.07% | 109 |
| 02/11/2035 | 6.90 | 100.18% | 30 |
| 23/03/2037 | 6.90 | 102.34% | 139 |
Closing Date: June 26, 2024
Lebanese Forex Market
| Last Price | Previous | % Change | |
| $/LBP | 89,500 | 89,500 | – |
| €/LBP | 95,711.30 | 95,577.05 | 0.14% |
| £/LBP | 113,101.15 | 112,949.00 | 0.13% |
| NEER | 228.07 | 228.21 | -0.06% |
Closing Date: June 27, 2024