
Discover today’s performance of BLOM indices, the closing prices of Lebanese stocks and Eurobonds, as well as the exchange rate of major currencies against the LBP.
BLOM Stock Index (BSI) – today’s performance
| Last | Previous | % Change | Y-t-D Change | |
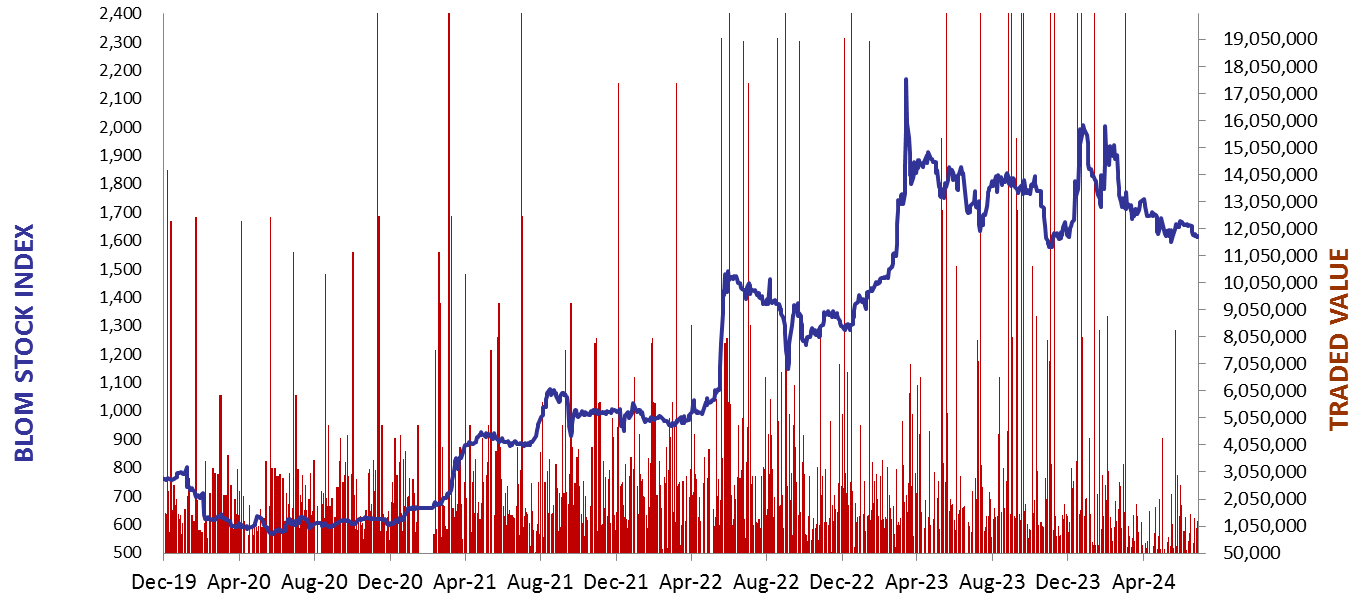
| BSI | 1,618.61 | 1,612.08 | 0.41% | -17.96% |
| High | 1,619.92 | 1,616.72 | ||
| Low | 1,612.08 | 1,611.58 | ||
| Volume | 38,993 | 22,694 | ||
| Val ($) | 533,686 | 1,567,696 |
I): BLOM preferred Shares Index (BPSI): today’s Performance
| Last | Previous | Change | |
| BPSI | 35.15 | 35.15 | 0.00% |
| Volume | |||
| Value |
Lebanese Stocks: today’s Trades and Closing Prices
| Last Price ($) | % Change | Volume | VWAP ($) | |
| Solidere A | 69.55 | 0.72% | 4,965 | 69.55 |
| Solidere B | 69.00 | 0.00% | 1,069 | 69.00 |
| BLOM GDR | 3.48 | 7.08% | 32,959 | 3.50 |
Closing Date: July 01, 2024
The BLOM Stock Index
BLOM BOND INDEX: Last Session’s Performance
| Last | Previous | Change | Y-t-D Change | ||
| BBI | 6.21 | 6.23 | -0.38% | 2.97% | |
| Weighted Yield | 268.84% | 267.40% | 143 | bps | |
| Duration (Years) | 1.39 | 1.40 | |||
| 5Y Bond Yield | 105.65% | 105.60% | 5 | bps | |
| 5Y Spread* | 10,056 | 10,050 | 6 | bps | |
| 10Y Bond Yield | 102.15% | 102.00% | 15 | bps | |
| 10Y Spread* | 9,763 | 9,751 | 12 | bps |
*spread between Lebanese Eurobonds and US Treasuries
| Price | Yield | Yield Change | |
| 26/02/2025 | 6.90 | 1271.18% | 987 |
| 12/06/2025 | 7.10 | 647.20% | 291 |
| 28/11/2026 | 6.88 | 194.37% | (14) |
| 23/03/2027 | 6.78 | 174.26% | 179 |
| 29/11/2027 | 6.78 | 145.63% | 126 |
| 03/11/2028 | 6.81 | 121.76% | 71 |
| 26/02/2030 | 6.88 | 105.95% | 3 |
| 22/04/2031 | 6.84 | 104.46% | 23 |
| 23/03/2032 | 6.89 | 101.38% | 15 |
| 02/11/2035 | 6.88 | 100.38% | 17 |
| 23/03/2037 | 6.87 | 102.72% | 13 |
Closing Date: June 28, 2024
Lebanese Forex Market
| Last Price | Previous | % Change | |
| $/LBP | 89,500 | 89,500 | – |
| €/LBP | 96,257.25 | 95,881.35 | 0.39% |
| £/LBP | 113,360.70 | 113,145.90 | 0.19% |
| NEER | 227.73 | 228.26 | -0.23% |
Closing Date: July 1, 2024