
Discover today’s performance of BLOM indices, the closing prices of Lebanese stocks and Eurobonds, as well as the exchange rate of major currencies against the LBP.
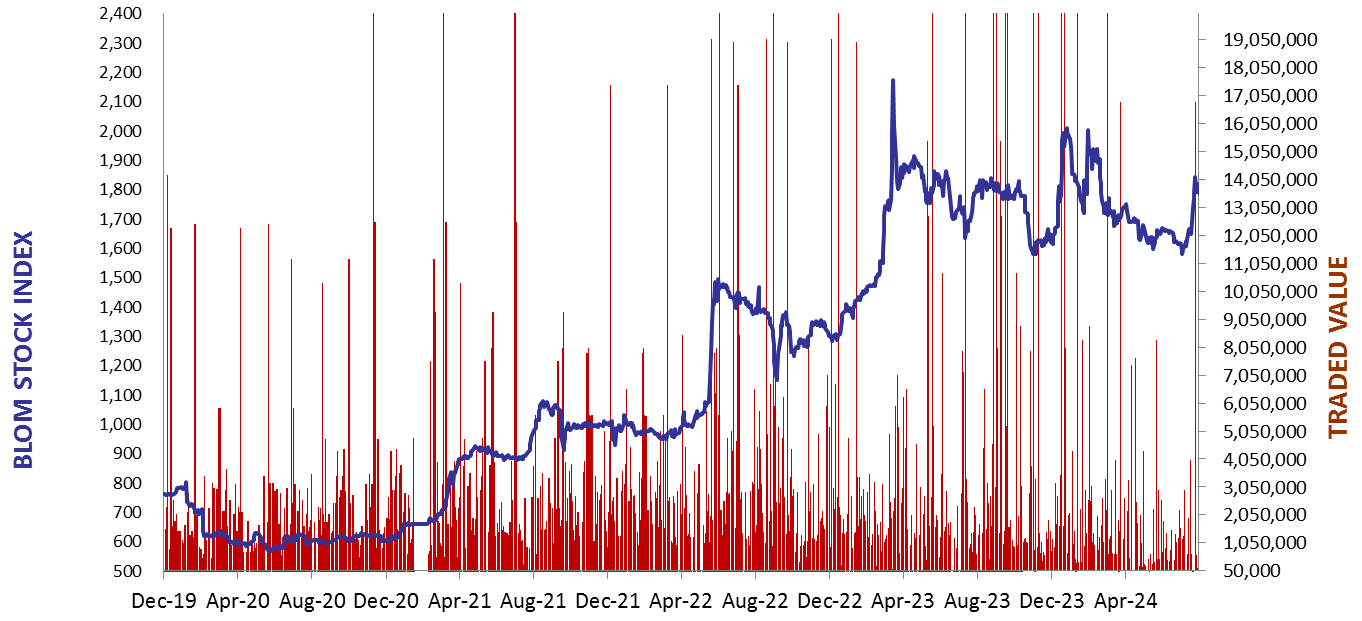
BLOM Stock Index (BSI) – today’s performance
| Last | Previous | % Change | Y-t-D Change | |
| BSI | 1,722.12 | 1,761.27 | -2.22% | -12.72% |
| High | 1,729.88 | 1,796.35 | ||
| Low | 1,711.65 | 1,750.13 | ||
| Volume | 32,983 | 96,815 | ||
| Val ($) | 2,522,080 | 7,647,181 |
I): BLOM preferred Shares Index (BPSI): today’s Performance
| Last | Previous | Change | |
| BPSI | 27.78 | 27.78 | 0.00% |
| Volume | |||
| Value |
Lebanese Stocks: today’s Trades and Closing Prices
| Last Price ($) | % Change | Volume | VWAP ($) | |
| Solidere A | 75.50 | -3.27% | 28,748 | 76.39 |
| Solidere B | 77.00 | -2.84% | 4,235 | 77.00 |
Closing Date: August 08, 2024
The BLOM Stock Index
BLOM BOND INDEX: Last Session’s Performance
| Last | Previous | Change | Y-t-D Change | ||
| BBI | 6.01 | 6.05 | -0.56% | -0.30% | |
| Weighted Yield | 351.69% | 346.33% | 536 | bps | |
| Duration (Years) | 1.24 | 1.25 | |||
| 5Y Bond Yield | 109.50% | 108.90% | 60 | bps | |
| 5Y Spread* | 10,505 | 10,444 | 61 | bps | |
| 10Y Bond Yield | 106.10% | 104.90% | 120 | bps | |
| 10Y Spread* | 10,229 | 10,114 | 115 | bps |
*spread between Lebanese Eurobonds and US Treasuries
| Price | Yield | Yield Change | |
| 26/02/2025 | 6.60 | 2086.88% | 5,521 |
| 12/06/2025 | 6.78 | 802.93% | 617 |
| 28/11/2026 | 6.64 | 205.68% | (39) |
| 23/03/2027 | 6.64 | 183.68% | 19 |
| 29/11/2027 | 6.64 | 149.89% | 85 |
| 03/11/2028 | 6.64 | 125.28% | 78 |
| 26/02/2030 | 6.67 | 110.30% | 51 |
| 22/04/2031 | 6.61 | 107.67% | 91 |
| 23/03/2032 | 6.63 | 105.59% | 138 |
| 02/11/2035 | 6.62 | 103.68% | 162 |
| 23/03/2037 | 6.71 | 105.78% | 47 |
Closing Date: August 07, 2024
Lebanese Forex Market
| Last Price | Previous | % Change | |
| $/LBP | 89,500 | 89,500 | – |
| €/LBP | 97,850.35 | 97,742.95 | 0.11% |
| £/LBP | 113,620.25 | 113,584.45 | 0.03% |
| NEER | 229.06 | 228.60 | 0.20% |
Closing Date: August 08, 2024