
Discover today’s performance of BLOM indices, the closing prices of Lebanese stocks and Eurobonds, as well as the exchange rate of major currencies against the LBP.
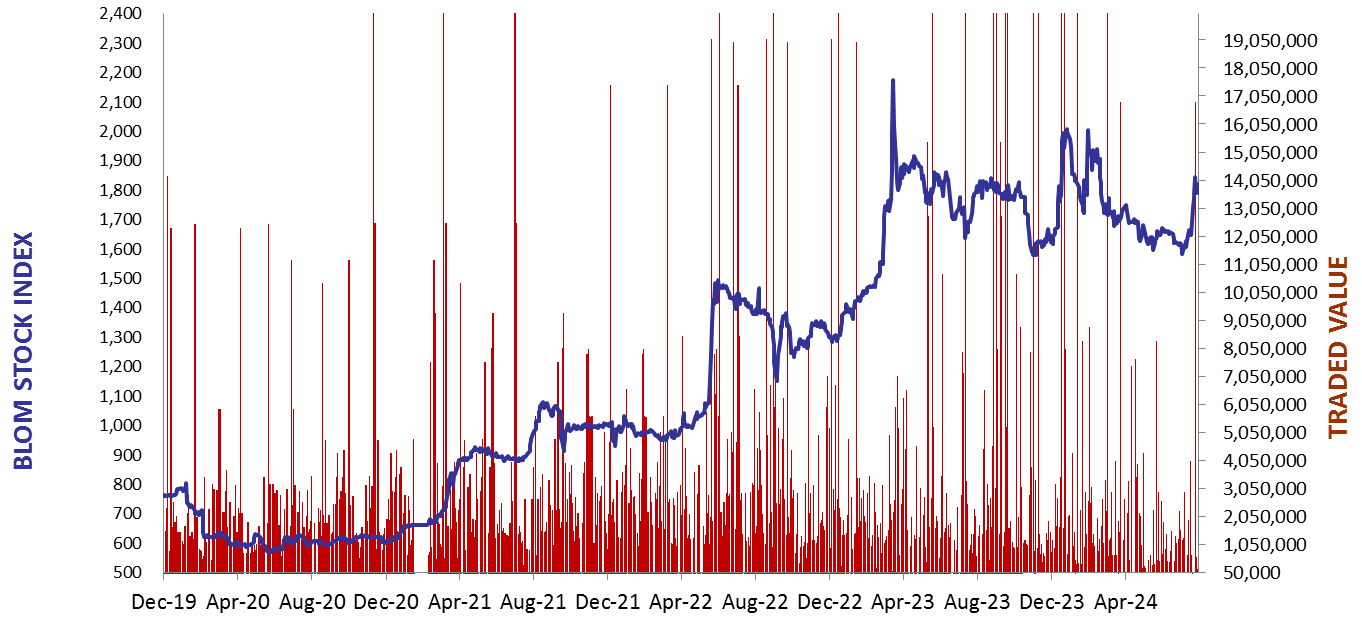
BLOM Stock Index (BSI) – today’s performance
| Last | Previous | % Change | Y-t-D Change | |
| BSI | 1,739.24 | 1,764.40 | -1.43% | -11.85% |
| High | 1,764.40 | 1,778.93 | ||
| Low | 1,738.03 | 1,742.36 | ||
| Volume | 4,043 | 70,692 | ||
| Val ($) | 69,686 | 2,174,035 |
I): BLOM preferred Shares Index (BPSI): today’s Performance
| Last | Previous | Change | |
| BPSI | 27.78 | 27.78 | 0.00% |
| Volume | |||
| Value |
Lebanese Stocks: today’s Trades and Closing Prices
| Last Price ($) | % Change | Volume | VWAP ($) | |
| Solidere A | 79.00 | -3.42% | 743 | 79.00 |
| BLOM GDR | 3.33 | 9.90% | 3,300 | 3.30 |
Closing Date: August 16, 2024
The BLOM Stock Index
BLOM BOND INDEX: Last Session’s Performance
| Last | Previous | Change | Y-t-D Change | ||
| BBI | 5.83 | 5.88 | -0.72% | -3.28% | |
| Weighted Yield | 385.20% | 381.07% | 414 | bps | |
| Duration (Years) | 1.19 | 1.20 | |||
| 5Y Bond Yield | 111.90% | 111.60% | 30 | bps | |
| 5Y Spread* | 10,748 | 10,720 | 28 | bps | |
| 10Y Bond Yield | 107.95% | 107.30% | 65 | bps | |
| 10Y Spread* | 10,419 | 10,355 | 64 | bps |
*spread between Lebanese Eurobonds and US Treasuries
| Price | Yield | Yield Change | |
| 26/02/2025 | 6.37 | 2410.96% | 2,758 |
| 12/06/2025 | 6.51 | 858.38% | 1,404 |
| 28/11/2026 | 6.31 | 213.23% | 463 |
| 23/03/2027 | 6.39 | 189.43% | (100) |
| 29/11/2027 | 6.50 | 152.36% | 61 |
| 03/11/2028 | 6.50 | 127.37% | 47 |
| 26/02/2030 | 6.50 | 112.97% | 43 |
| 22/04/2031 | 6.48 | 109.51% | (101) |
| 23/03/2032 | 6.54 | 107.11% | 72 |
| 02/11/2035 | 6.54 | 104.97% | 71 |
| 23/03/2037 | 6.54 | 108.62% | (51) |
Closing Date: August 14, 2024
Lebanese Forex Market
| Last Price | Previous | % Change | |
| $/LBP | 89,500 | 89,500 | – |
| €/LBP | 98,306.80 | 98,190.45 | 0.12% |
| £/LBP | 115,213.35 | 115,016.45 | 0.17% |
| NEER | 229.43 | 229.21 | 0.10% |
Closing Date: August 16, 2024