
Discover today’s performance of BLOM indices, the closing prices of Lebanese stocks and Eurobonds, as well as the exchange rate of major currencies against the LBP.
BLOM Stock Index (BSI) – today’s performance
| Last | Previous | % Change | Y-t-D Change | |
| BSI | 1,834.19 | 1,819.80 | 0.79% | -7.03% |
| High | 1,844.69 | 1,826.31 | ||
| Low | 1,819.80 | 1,811.47 | ||
| Volume | 14,730 | 2,154 | ||
| Val ($) | 1,203,249 | 175,505 |
I): BLOM preferred Shares Index (BPSI): today’s Performance
| Last | Previous | Change | |
| BPSI | 27.78 | 27.78 | 0.00% |
| Volume | |||
| Value |
Lebanese Stocks: today’s Trades and Closing Prices
| Last Price ($) | % Change | Volume | VWAP ($) | |
| Solidere A | 82.65 | 1.41% | 7,401 | 81.55 |
| Solidere B | 81.00 | 0.62% | 7,329 | 81.83 |
Closing Date: August 29, 2024
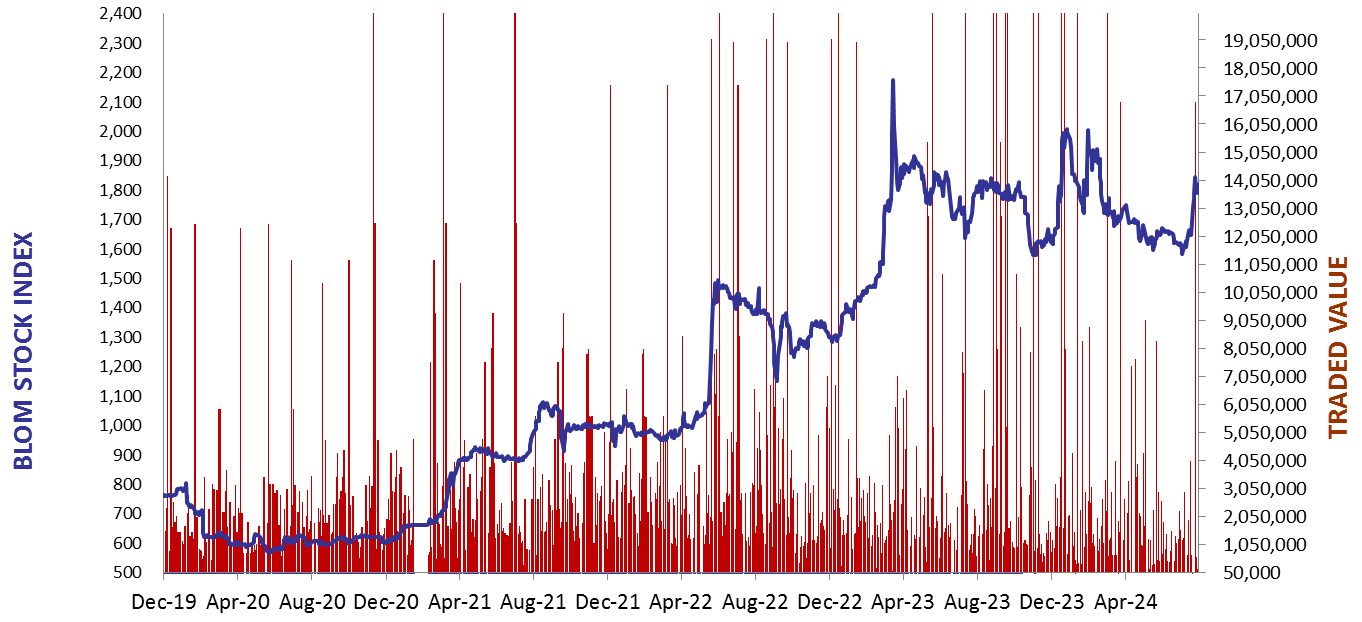
The BLOM Stock Index
BLOM BOND INDEX: Last Session’s Performance
| Last | Previous | Change | Y-t-D Change | ||
| BBI | 5.46 | 5.47 | -0.07% | -9.41% | |
| Weighted Yield | 214.25% | 213.53% | 72 | bps | |
| Duration (Years) | 1.32 | 1.32 | |||
| 5Y Bond Yield | 108.05% | 108.00% | 5 | bps | |
| 5Y Spread* | 10,369 | 10,436 | -67 | bps | |
| 10Y Bond Yield | 104.30% | 104.60% | -30 | bps | |
| 10Y Spread* | 10,058 | 10,173 | -115 | bps |
*spread between Lebanese Eurobonds and US Treasuries
| Price | Yield | Yield Change | |
| 12/06/2025 | 6.65 | 918.77% | 641 |
| 28/11/2026 | 6.55 | 212.25% | 26 |
| 23/03/2027 | 6.55 | 190.49% | 47 |
| 29/11/2027 | 6.55 | 152.94% | 18 |
| 03/11/2028 | 6.54 | 127.78% | 3 |
| 26/02/2030 | 6.53 | 113.40% | (3) |
| 22/04/2031 | 6.56 | 108.74% | (13) |
| 23/03/2032 | 6.61 | 106.76% | 37 |
| 02/11/2035 | 6.63 | 103.81% | (30) |
| 23/03/2037 | 6.60 | 108.23% | 27 |
Closing Date: August 28, 2024
Lebanese Forex Market
| Last Price | Previous | % Change | |
| $/LBP | 89,500 | 89,500 | – |
| €/LBP | 99,658.25 | 99,524.00 | 0.13% |
| £/LBP | 118,274.25 | 118,050.50 | 0.19% |
| NEER | 230.04 | 229.97 | 0.03% |
Closing Date: August 29, 2024