
Discover today’s performance of BLOM indices, the closing prices of Lebanese stocks and Eurobonds, as well as the exchange rate of major currencies against the LBP.
BLOM Stock Index (BSI) – today’s performance
| Last | Previous | % Change | Y-t-D Change | |
| BSI | 1,918.26 | 1,874.77 | 2.32% | -2.77% |
| High | 1,932.13 | 1,886.23 | ||
| Low | 1,902.40 | 1,834.19 | ||
| Volume | 15,450 | 117,671 | ||
| Val ($) | 1,338,090 | 6,624,709 |
I): BLOM preferred Shares Index (BPSI): today’s Performance
| Last | Previous | Change | |
| BPSI | 27.78 | 27.78 | 0.00% |
| Volume | |||
| Value |
Lebanese Stocks: today’s Trades and Closing Prices
| Last Price ($) | % Change | Volume | VWAP ($) | |
| Solidere A | 88.25 | 4.87% | 13,789 | 86.74 |
| Solidere B | 85.55 | 0.65% | 1,661 | 85.54 |
Closing Date: September 2, 2024
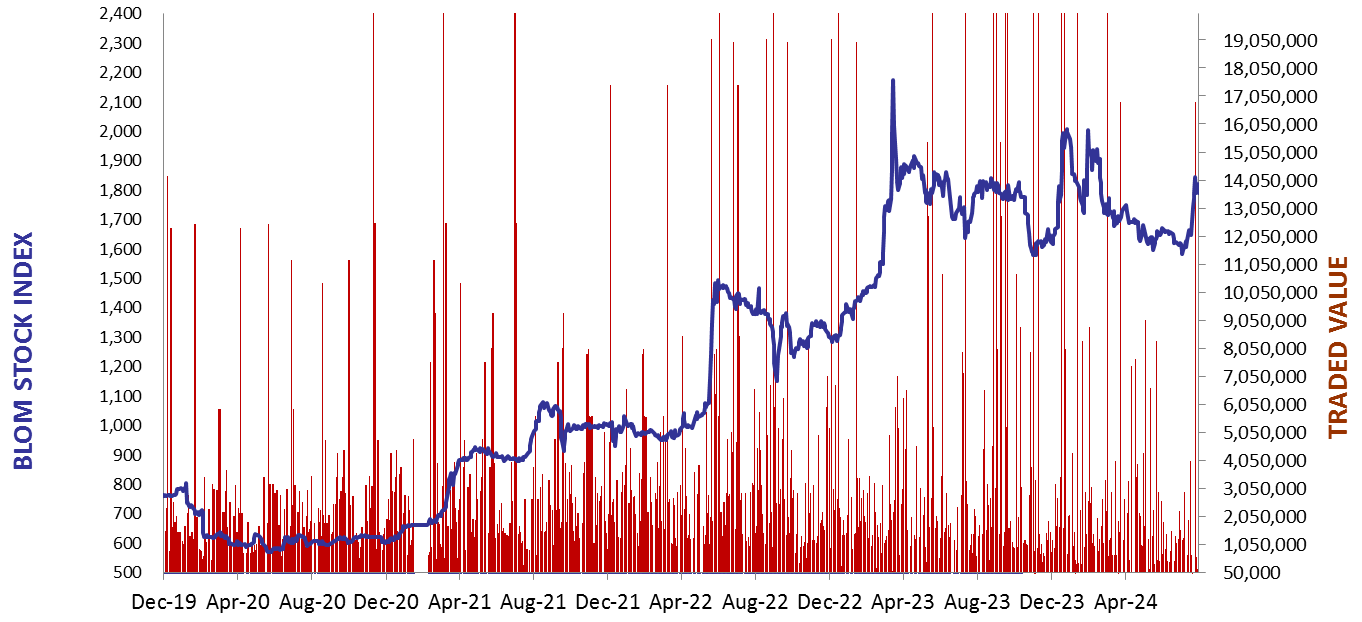
The BLOM Stock Index
BLOM BOND INDEX: Last Session’s Performance
| Last | Previous | Change | Y-t-D Change | ||
| BBI | 5.41 | 5.45 | -0.75% | -10.30% | |
| Weighted Yield | 216.70% | 215.12% | 158 | bps | |
| Duration (Years) | 1.30 | 1.31 | |||
| 5Y Bond Yield | 108.90% | 108.10% | 80 | bps | |
| 5Y Spread* | 10,452 | 10,372 | 80 | bps | |
| 10Y Bond Yield | 106.00% | 105.00% | 100 | bps | |
| 10Y Spread* | 10,221 | 10,124 | 97 | bps |
*spread between Lebanese Eurobonds and US Treasuries
| Price | Yield | Yield Change | |
| 12/06/2025 | 6.63 | 933.16% | 839 |
| 28/11/2026 | 6.50 | 213.73% | 99 |
| 23/03/2027 | 6.43 | 193.05% | 206 |
| 29/11/2027 | 6.50 | 153.84% | 60 |
| 03/11/2028 | 6.50 | 128.35% | 49 |
| 26/02/2030 | 6.50 | 113.79% | 36 |
| 22/04/2031 | 6.51 | 109.60% | 91 |
| 23/03/2032 | 6.53 | 108.02% | 58 |
| 02/11/2035 | 6.52 | 105.42% | 93 |
| 23/03/2037 | 6.51 | 109.79% | 122 |
Closing Date: August 30, 2024
Lebanese Forex Market
| Last Price | Previous | % Change | |
| $/LBP | 89,500 | 89,500 | – |
| €/LBP | 98,933.30 | 98,870.65 | 0.06% |
| £/LBP | 117,531.40 | 117,477.70 | 0.05% |
| NEER | 229.98 | 229.98 | 0.00% |
Closing Date: September 2, 2024