
Discover today’s performance of BLOM indices, the closing prices of Lebanese stocks and Eurobonds, as well as the exchange rate of major currencies against the LBP.
BLOM Stock Index (BSI) – today’s performance
| Last | Previous | % Change | Y-t-D Change | |
| BSI | 1,929.38 | 1,918.26 | 0.58% | -2.21% |
| High | 1,943.64 | 1,932.13 | ||
| Low | 1,920.11 | 1,902.40 | ||
| Volume | 93,027 | 15,450 | ||
| Val ($) | 2,896,755 | 1,338,090 |
I): BLOM preferred Shares Index (BPSI): today’s Performance
| Last | Previous | Change | |
| BPSI | 27.78 | 27.78 | 0.00% |
| Volume | |||
| Value |
Lebanese Stocks: today’s Trades and Closing Prices
| Last Price ($) | % Change | Volume | VWAP ($) | |
| Solidere A | 88.65 | 0.45% | 20,279 | 87.82 |
| Solidere B | 87.20 | 1.93% | 10,748 | 86.50 |
| BLOM GDR | 3.00 | -13.04% | 62,000 | 3.00 |
Closing Date: September 3, 2024
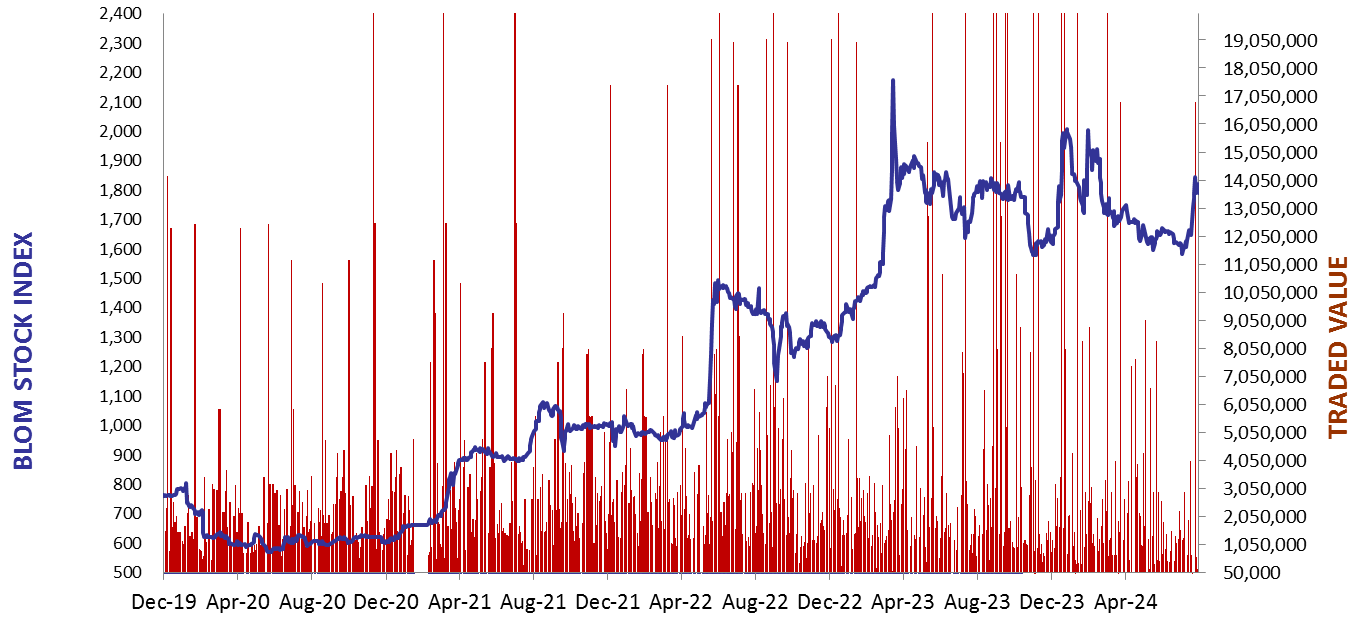
The BLOM Stock Index
BLOM BOND INDEX: Last Session’s Performance
| Last | Previous | Change | Y-t-D Change | ||
| BBI | 5.44 | 5.41 | 0.60% | -9.77% | |
| Weighted Yield | 217.26% | 216.70% | 56 | bps | |
| Duration (Years) | 1.30 | 1.30 | |||
| 5Y Bond Yield | 108.60% | 108.90% | -30 | bps | |
| 5Y Spread* | 10,422 | 10,452 | -30 | bps | |
| 10Y Bond Yield | 105.40% | 106.00% | -60 | bps | |
| 10Y Spread* | 10,161 | 10,221 | -60 | bps |
*spread between Lebanese Eurobonds and US Treasuries
| Price | Yield | Yield Change | |
| 12/06/2025 | 6.64 | 944.12% | 1,096 |
| 28/11/2026 | 6.54 | 213.58% | (15) |
| 23/03/2027 | 6.53 | 191.80% | (125) |
| 29/11/2027 | 6.53 | 153.70% | (14) |
| 03/11/2028 | 6.52 | 128.26% | (9) |
| 26/02/2030 | 6.52 | 113.45% | (33) |
| 22/04/2031 | 6.54 | 109.22% | (38) |
| 23/03/2032 | 6.56 | 107.62% | (40) |
| 02/11/2035 | 6.58 | 104.67% | (75) |
| 23/03/2037 | 6.54 | 109.53% | (26) |
Closing Date: September 2, 2024
Lebanese Forex Market
| Last Price | Previous | % Change | |
| $/LBP | 89,500 | 89,500 | – |
| €/LBP | 98,978.05 | 99,085.45 | -0.11% |
| £/LBP | 117,459.80 | 117,683.55 | -0.19% |
| NEER | 229.65 | 229.98 | -0.14% |
Closing Date: September 3, 2024