
Discover today’s performance of BLOM indices, the closing prices of Lebanese stocks and Eurobonds, as well as the exchange rate of major currencies against the LBP.
BLOM Stock Index (BSI) – today’s performance
| Last | Previous | % Change | Y-t-D Change | |
| BSI | 1,964.65 | 1,927.60 | 1.92% | -0.42% |
| High | 1,975.25 | 1,932.69 | ||
| Low | 1,958.66 | 1,918.72 | ||
| Volume | 20,664 | 19,700 | ||
| Val ($) | 1,848,640 | 886,350 |
I): BLOM preferred Shares Index (BPSI): today’s Performance
| Last | Previous | Change | |
| BPSI | 27.78 | 27.78 | 0.00% |
| Volume | |||
| Value |
Lebanese Stocks: today’s Trades and Closing Prices
| Last Price ($) | % Change | Volume | VWAP ($) | |
| Solidere A | 89.95 | 1.98% | 12,796 | 89.32 |
| Solidere B | 89.75 | 3.64% | 7,868 | 89.70 |
Closing Date: September 13, 2024
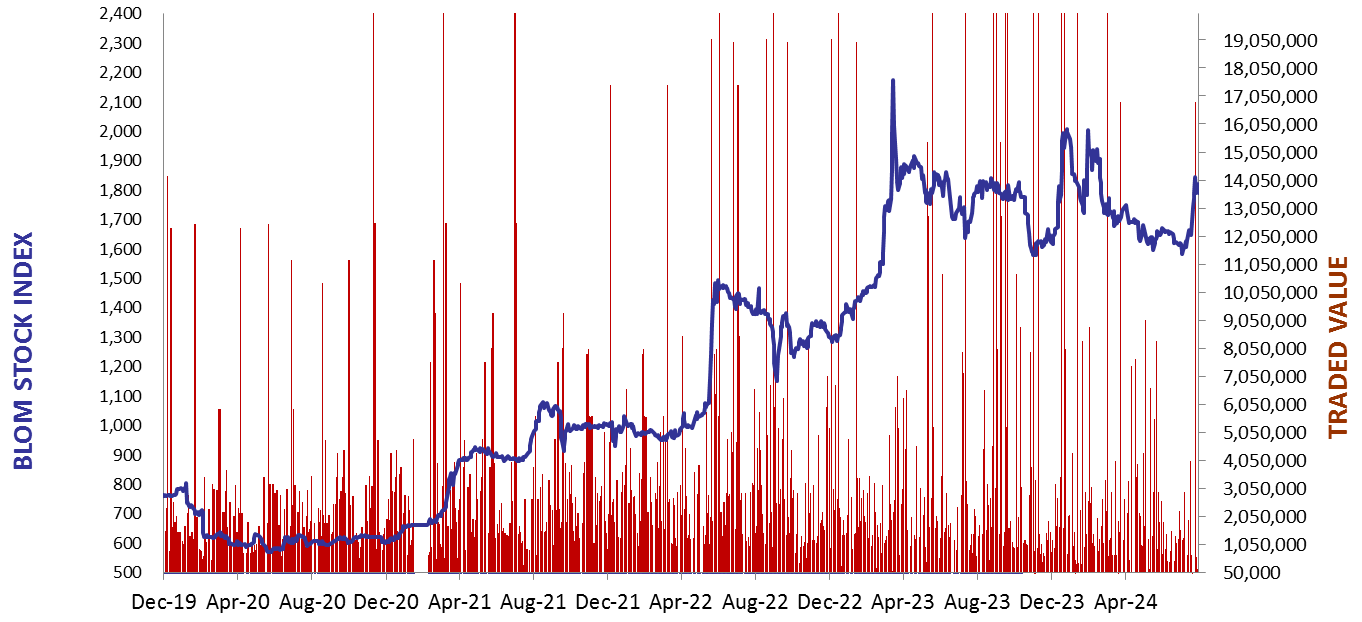
The BLOM Stock Index
BLOM BOND INDEX: Last Session’s Performance
| Last | Previous | Change | Y-t-D Change | ||
| BBI | 5.44 | 5.44 | 0.08% | -9.72% | |
| Weighted Yield | 223.79% | 223.36% | 43 | bps | |
| Duration (Years) | 1.26 | 1.27 | |||
| 5Y Bond Yield | 109.00% | 108.80% | 20 | bps | |
| 5Y Spread* | 10,491 | 10,468 | 23 | bps | |
| 10Y Bond Yield | 105.80% | 106.00% | -20 | bps | |
| 10Y Spread* | 10,233 | 10,255 | -22 | bps |
*spread between Lebanese Eurobonds and US Treasuries
| Price | Yield | Yield Change | |
| 12/06/2025 | 6.68 | 1005.84% | 397 |
| 28/11/2026 | 6.53 | 216.62% | 27 |
| 23/03/2027 | 6.54 | 194.70% | 12 |
| 29/11/2027 | 6.52 | 154.79% | 10 |
| 03/11/2028 | 6.53 | 128.87% | 4 |
| 26/02/2030 | 6.53 | 113.10% | (11) |
| 22/04/2031 | 6.53 | 109.73% | 11 |
| 23/03/2032 | 6.58 | 108.01% | 33 |
| 02/11/2035 | 6.57 | 104.92% | (49) |
| 23/03/2037 | 6.52 | 110.38% | 17 |
Closing Date: September 12, 2024
Lebanese Forex Market
| Last Price | Previous | % Change | |
| $/LBP | 89,500 | 89,500 | – |
| €/LBP | 99,210.75 | 99,112.30 | 0.10% |
| £/LBP | 117,647.75 | 117,450.85 | 0.17% |
| NEER | 229.70 | 229.88 | -0.08% |
Closing Date: September 13, 2024