
Discover today’s performance of BLOM indices, the closing prices of Lebanese stocks and Eurobonds, as well as the exchange rate of major currencies against the LBP.
BLOM Stock Index (BSI) – today’s performance
| Last | Previous | % Change | Y-t-D Change | |
| BSI | 2,012.07 | 2,049.08 | -1.81% | 1.98% |
| High | 2,049.08 | 2,056.72 | ||
| Low | 2,003.69 | 2,041.21 | ||
| Volume | 5,086 | 22,194 | ||
| Val ($) | 452,891 | 124,623 |
I): BLOM preferred Shares Index (BPSI): today’s Performance
| Last | Previous | Change | |
| BPSI | 27.78 | 27.78 | 0.00% |
| Volume | |||
| Value |
Lebanese Stocks: today’s Trades and Closing Prices
| Last Price ($) | % Change | Volume | VWAP ($) | |
| Solidere A | 89.05 | -1.00% | 5,066 | 89.06 |
| Solidere B | 85.05 | -4.97% | 20 | 85.05 |
Closing Date: September 18, 2024
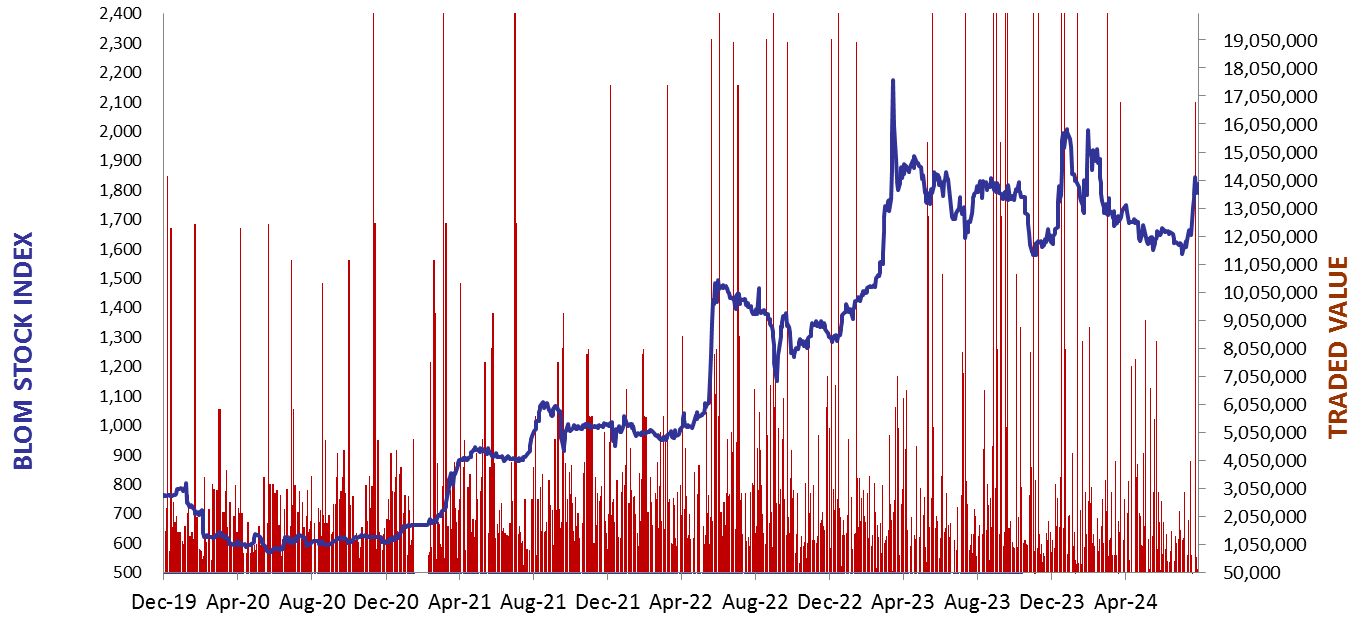
The BLOM Stock Index
BLOM BOND INDEX: Last Session’s Performance
| Last | Previous | Change | Y-t-D Change | ||
| BBI | 5.48 | 5.46 | 0.31% | -9.20% | |
| Weighted Yield | 226.72% | 224.17% | 256 | bps | |
| Duration (Years) | 1.25 | 1.26 | |||
| 5Y Bond Yield | 109.00% | 108.80% | 20 | bps | |
| 5Y Spread* | 10,501 | 10,480 | 21 | bps | |
| 10Y Bond Yield | 105.20% | 105.10% | 10 | bps | |
| 10Y Spread* | 10,175 | 10,168 | 7 | bps |
*spread between Lebanese Eurobonds and US Treasuries
| Price | Yield | Yield Change | |
| 12/06/2025 | 6.72 | 1038.00% | 2,647 |
| 28/11/2026 | 6.54 | 217.81% | 111 |
| 23/03/2027 | 6.56 | 195.91% | 108 |
| 29/11/2027 | 6.55 | 154.99% | 38 |
| 03/11/2028 | 6.55 | 129.02% | 8 |
| 26/02/2030 | 6.62 | 111.91% | (100) |
| 22/04/2031 | 6.55 | 109.73% | 37 |
| 23/03/2032 | 6.63 | 107.55% | (18) |
| 02/11/2035 | 6.63 | 104.26% | 4 |
| 23/03/2037 | 6.54 | 110.50% | 33 |
Closing Date: September 17, 2024
Lebanese Forex Market
| Last Price | Previous | % Change | |
| $/LBP | 89,500 | 89,500 | – |
| €/LBP | 99,631.40 | 99,461.35 | 0.17% |
| £/LBP | 118,265.30 | 117,782.00 | 0.41% |
| NEER | 229.96 | 229.76 | 0.09% |
Closing Date: September 18, 2024