
Discover today’s performance of BLOM indices, the closing prices of Lebanese stocks and Eurobonds, as well as the exchange rate of major currencies against the LBP.
BLOM Stock Index (BSI) – today’s performance
| Last | Previous | % Change | Y-t-D Change | |
| BSI | 2,020.42 | 2,012.07 | 0.41% | 2.40% |
| High | 2,024.96 | 2,049.08 | ||
| Low | 2,002.10 | 2,003.69 | ||
| Volume | 69,363 | 5,086 | ||
| Val ($) | 6,075,642 | 452,891 |
I): BLOM preferred Shares Index (BPSI): today’s Performance
| Last | Previous | Change | |
| BPSI | 27.78 | 27.78 | 0.00% |
| Volume | |||
| Value |
Lebanese Stocks: today’s Trades and Closing Prices
| Last Price ($) | % Change | Volume | VWAP ($) | |
| Solidere A | 88.80 | -0.28% | 64,287 | 87.66 |
| Solidere B | 86.75 | 2.00% | 5,076 | 86.74 |
Closing Date: September 19, 2024
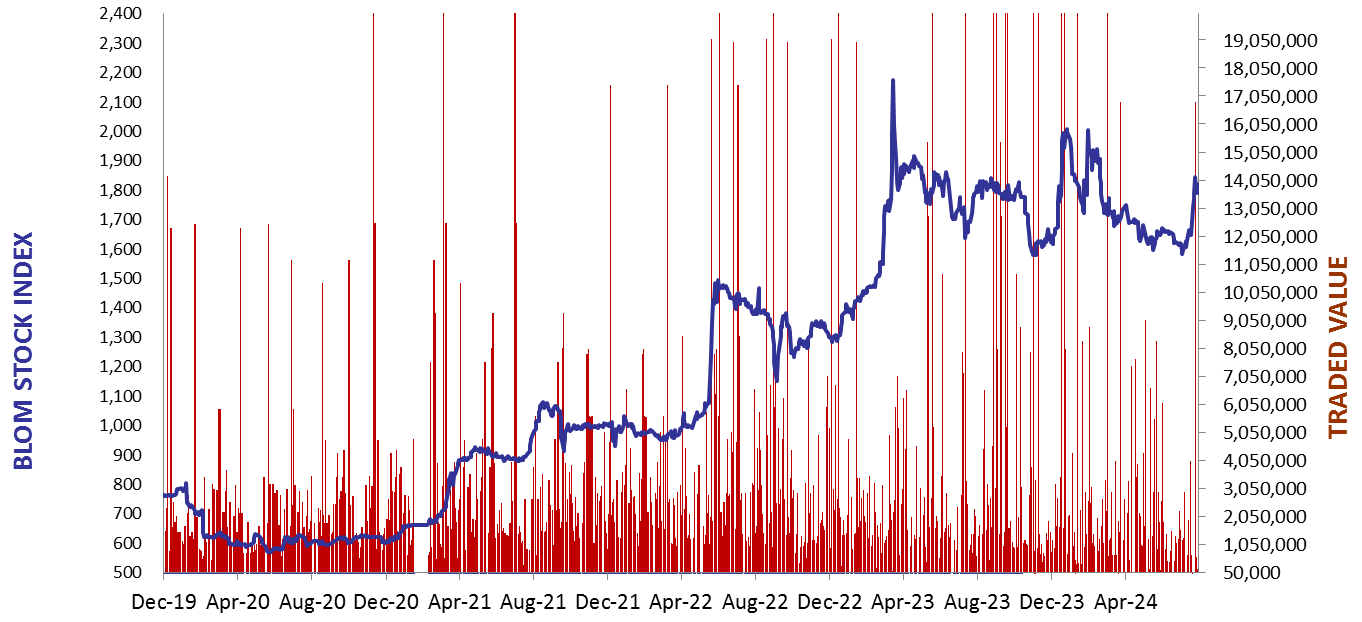
The BLOM Stock Index
BLOM BOND INDEX: Last Session’s Performance
| Last | Previous | Change | Y-t-D Change | ||
| BBI | 5.47 | 5.48 | -0.07% | -9.27% | |
| Weighted Yield | 227.69% | 226.72% | 96 | bps | |
| Duration (Years) | 1.25 | 1.25 | |||
| 5Y Bond Yield | 109.20% | 109.00% | 20 | bps | |
| 5Y Spread* | 10,525 | 10,501 | 24 | bps | |
| 10Y Bond Yield | 105.60% | 105.20% | 40 | bps | |
| 10Y Spread* | 10,211 | 10,175 | 36 | bps |
*spread between Lebanese Eurobonds and US Treasuries
| Price | Yield | Yield Change | |
| 12/06/2025 | 6.71 | 1046.89% | 890 |
| 28/11/2026 | 6.53 | 218.28% | 47 |
| 23/03/2027 | 6.57 | 196.12% | 20 |
| 29/11/2027 | 6.53 | 155.38% | 38 |
| 03/11/2028 | 6.57 | 128.80% | (22) |
| 26/02/2030 | 6.63 | 111.72% | (19) |
| 22/04/2031 | 6.55 | 109.77% | 3 |
| 23/03/2032 | 6.56 | 108.64% | 110 |
| 02/11/2035 | 6.63 | 104.25% | (1) |
| 23/03/2037 | 6.57 | 109.99% | (51) |
Closing Date: September 18, 2024
Lebanese Forex Market
| Last Price | Previous | % Change | |
| $/LBP | 89,500 | 89,500 | – |
| €/LBP | 99,586.65 | 99,506.10 | 0.08% |
| £/LBP | 118,310.05 | 118,247.40 | 0.05% |
| NEER | 229.83 | 229.96 | -0.06% |
Closing Date: September 19, 2024