
Discover today’s performance of BLOM indices, the closing prices of Lebanese stocks and Eurobonds, as well as the exchange rate of major currencies against the LBP.
BLOM Stock Index (BSI) – today’s performance
| Last | Previous | % Change | Y-t-D Change | |
| BSI | 2,055.58 | 2,033.70 | 1.08% | 4.19% |
| High | 2,058.72 | 2,046.43 | ||
| Low | 2,032.69 | 2,026.13 | ||
| Volume | 20,205 | 19,859 | ||
| Val ($) | 1,818,041 | 1,760,055 |
I): BLOM preferred Shares Index (BPSI): today’s Performance
| Last | Previous | Change | |
| BPSI | 27.78 | 27.78 | 0.00% |
| Volume | |||
| Value |
Lebanese Stocks: today’s Trades and Closing Prices
| Last Price ($) | % Change | Volume | VWAP ($) | |
| Solidere A | 90.00 | 0.73% | 15,205 | 89.99 |
| Solidere B | 89.95 | 2.80% | 5,000 | 89.96 |
Closing Date: September 26, 2024
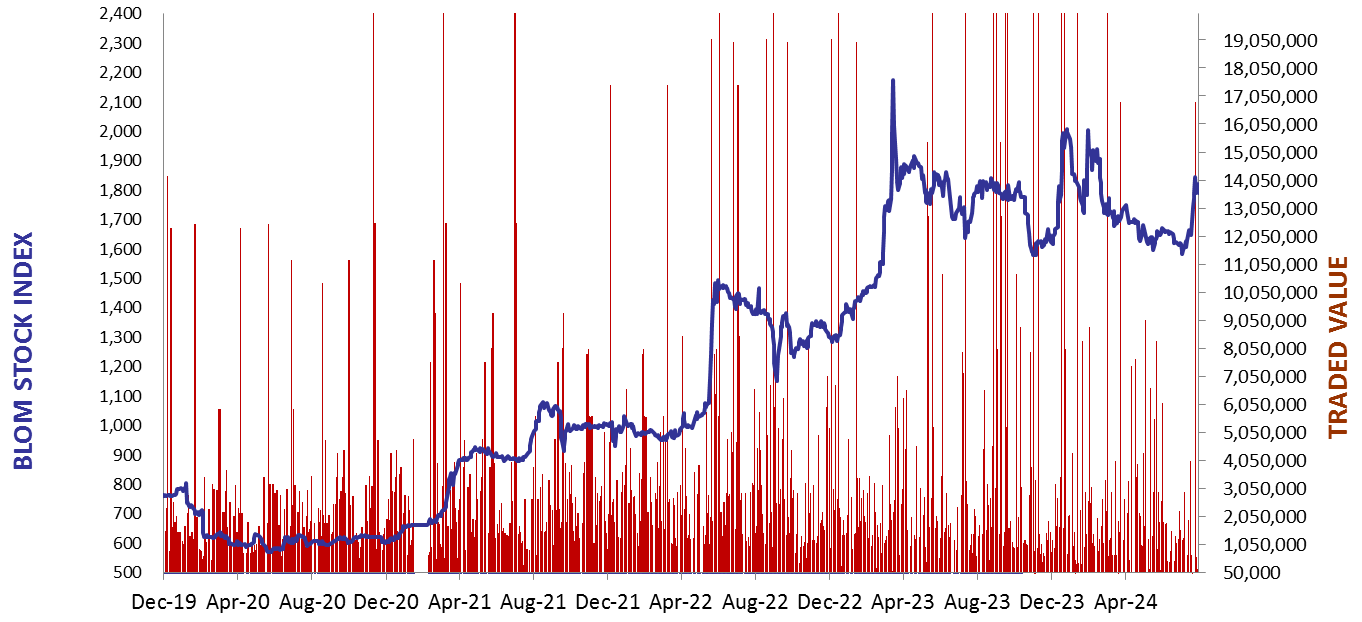
The BLOM Stock Index
BLOM BOND INDEX: Last Session’s Performance
| Last | Previous | Change | Y-t-D Change | ||
| BBI | 4.82 | 5.30 | -9.04% | -20.13% | |
| Weighted Yield | 254.60% | 238.37% | 1622 | bps | |
| Duration (Years) | 1.30 | 1.38 | |||
| 5Y Bond Yield | 122.40% | 112.80% | 960 | bps | |
| 5Y Spread* | 11,851 | 10,892 | 959 | bps | |
| 10Y Bond Yield | 120.00% | 109.90% | 1010 | bps | |
| 10Y Spread* | 11,651 | 10,646 | 1005 | bps |
*spread between Lebanese Eurobonds and US Treasuries
| Price | Yield | Yield Change | |
| 12/06/2025 | 5.96 | 1202.25% | 7,693 |
| 28/11/2026 | 5.79 | 235.70% | 1,136 |
| 23/03/2027 | 5.78 | 213.51% | 1,046 |
| 29/11/2027 | 5.78 | 167.82% | 819 |
| 03/11/2028 | 5.78 | 140.57% | 762 |
| 26/02/2030 | 5.76 | 124.11% | 1,080 |
| 22/04/2031 | 5.77 | 122.61% | 857 |
| 23/03/2032 | 5.79 | 122.32% | 1,246 |
| 02/11/2035 | 5.78 | 119.24% | 933 |
| 23/03/2037 | 5.78 | 125.29% | 1,162 |
Closing Date: September 25, 2024
Lebanese Forex Market
| Last Price | Previous | % Change | |
| $/LBP | 89,500 | 89,500 | – |
| €/LBP | 99,774.60 | 99,631.40 | 0.14% |
| £/LBP | 119,446.70 | 119,240.85 | 0.17% |
| NEER | 229.86 | 229.70 | 0.07% |
Closing Date: September 26, 2024