
Discover today’s performance of BLOM indices, the closing prices of Lebanese stocks and Eurobonds, as well as the exchange rate of major currencies against the LBP.
BLOM Stock Index (BSI) – today’s performance
| Last | Previous | % Change | Y-t-D Change | |
| BSI | 2,051.63 | 2,055.58 | -0.19% | 3.99% |
| High | 2,058.20 | 2,058.72 | ||
| Low | 2,046.22 | 2,032.69 | ||
| Volume | 73,190 | 20,205 | ||
| Val ($) | 742,523 | 1,818,041 |
I): BLOM preferred Shares Index (BPSI): today’s Performance
| Last | Previous | Change | |
| BPSI | 27.78 | 27.78 | 0.00% |
| Volume | |||
| Value |
Lebanese Stocks: today’s Trades and Closing Prices
| Last Price ($) | % Change | Volume | VWAP ($) | |
| Solidere A | 90.25 | 0.28% | 1,914 | 90.25 |
| Solidere B | 89.50 | -0.50% | 4,106 | 89.49 |
| BLOM GDR | 3.01 | -14.00% | 67,170 | 3.00 |
Closing Date: September 27, 2024
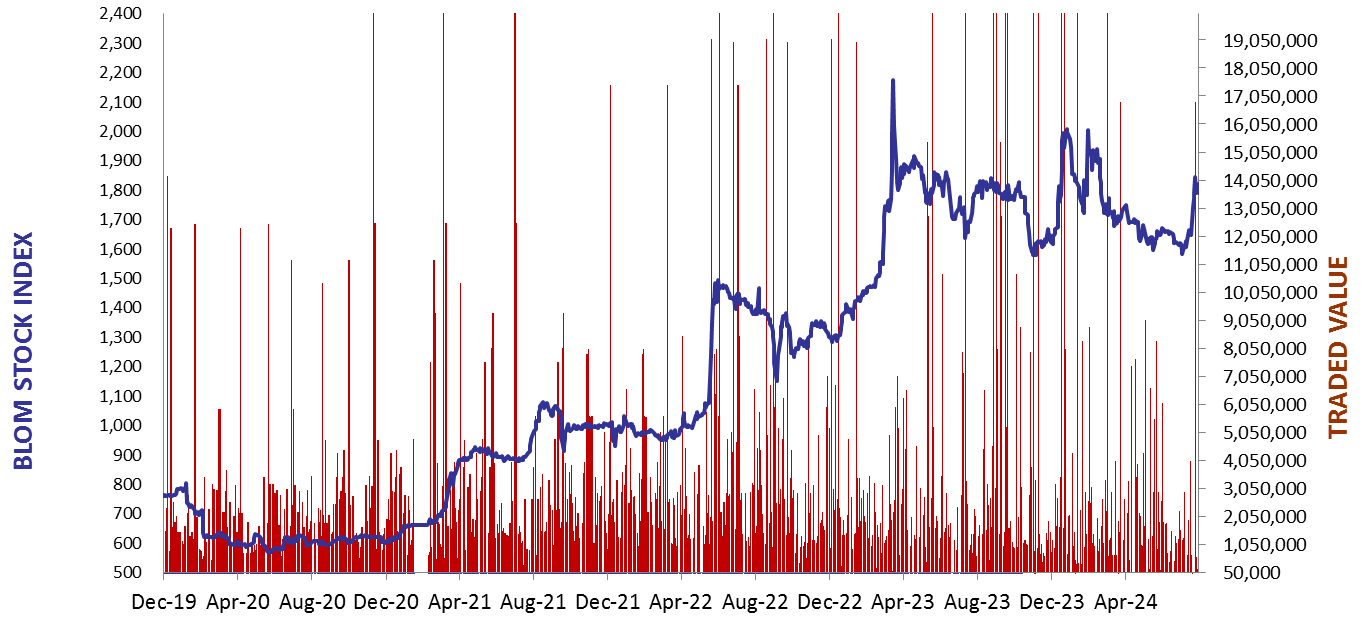
The BLOM Stock Index
BLOM BOND INDEX: Last Session’s Performance
| Last | Previous | Change | Y-t-D Change | ||
| BBI | 5.33 | 4.82 | 10.66% | -11.62% | |
| Weighted Yield | 239.13% | 254.60% | -1546 | bps | |
| Duration (Years) | 1.38 | 1.30 | |||
| 5Y Bond Yield | 112.60% | 122.40% | -980 | bps | |
| 5Y Spread* | 10,864 | 11,851 | -987 | bps | |
| 10Y Bond Yield | 108.80% | 120.00% | -1120 | bps | |
| 10Y Spread* | 10,526 | 11,651 | -1125 | bps |
*spread between Lebanese Eurobonds and US Treasuries
| Price | Yield | Yield Change | |
| 12/06/2025 | 6.48 | 1140.87% | (6,138) |
| 28/11/2026 | 6.37 | 223.96% | (1,175) |
| 23/03/2027 | 6.44 | 200.42% | (1,309) |
| 29/11/2027 | 6.43 | 157.79% | (1,003) |
| 03/11/2028 | 6.37 | 132.12% | (845) |
| 26/02/2030 | 6.39 | 114.75% | (937) |
| 22/04/2031 | 6.37 | 112.73% | (988) |
| 23/03/2032 | 6.36 | 111.90% | (1,042) |
| 02/11/2035 | 6.42 | 107.78% | (1,146) |
| 23/03/2037 | 6.50 | 111.44% | (1,385) |
Closing Date: September 26, 2024
Lebanese Forex Market
| Last Price | Previous | % Change | |
| $/LBP | 89,500 | 89,500 | – |
| €/LBP | 99,917.80 | 100,025.20 | -0.11% |
| £/LBP | 119,795.75 | 120,064.25 | -0.22% |
| NEER | 229.89 | 229.86 | 0.02% |
Closing Date: September 27, 2024