
Discover today’s performance of BLOM indices, the closing prices of Lebanese stocks and Eurobonds, as well as the exchange rate of major currencies against the LBP.
BLOM Stock Index (BSI) – today’s performance
| Last | Previous | % Change | Y-t-D Change | |
| BSI | 2,077.94 | 2,080.60 | -0.13% | 5.32% |
| High | 2,079.69 | 2,092.36 | ||
| Low | 2,066.22 | 2,070.49 | ||
| Volume | 24,450 | 57,527 | ||
| Val ($) | 2,199,070 | 4,643,754 |
I): BLOM preferred Shares Index (BPSI): today’s Performance
| Last | Previous | Change | |
| BPSI | 27.78 | 27.78 | 0.00% |
| Volume | |||
| Value |
Lebanese Stocks: today’s Trades and Closing Prices
| Last Price ($) | % Change | Volume | VWAP ($) | |
| Solidere A | 93.75 | 3.02% | 12,450 | 89.90 |
| Solidere B | 90.00 | -4.91% | 12,000 | 89.98 |
Closing Date: October 01, 2024
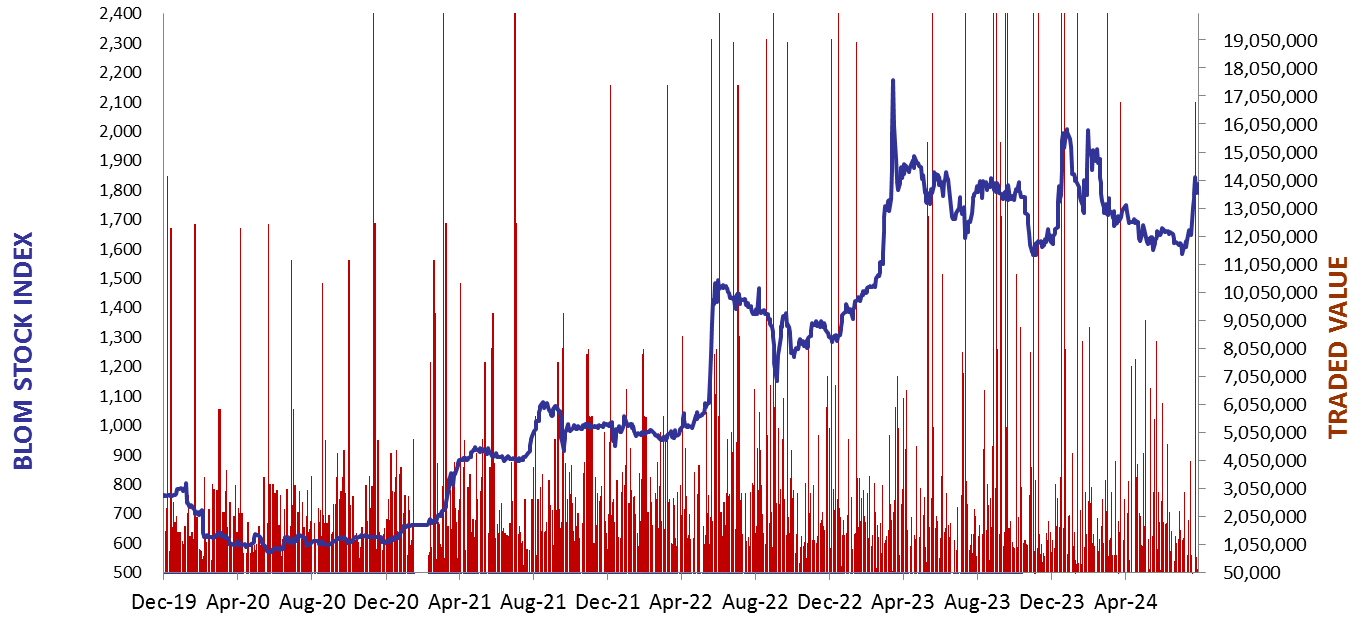
The BLOM Stock Index
BLOM BOND INDEX: Last Session’s Performance
| Last | Previous | Change | Y-t-D Change | ||
| BBI | 6.48 | 5.29 | 22.62% | 7.48% | |
| Weighted Yield | 210.78% | 240.43% | -2965 | bps | |
| Duration (Years) | 1.53 | 1.36 | |||
| 5Y Bond Yield | 95.00% | 113.40% | -1840 | bps | |
| 5Y Spread* | 9,102 | 10,950 | -1848 | bps | |
| 10Y Bond Yield | 91.00% | 110.00% | -1900 | bps | |
| 10Y Spread* | 8,742 | 10,651 | -1909 | bps |
*spread between Lebanese Eurobonds and US Treasuries
| Price | Yield | Yield Change | |
| 12/06/2025 | 7.94 | 1010.18% | (13,400) |
| 28/11/2026 | 7.79 | 201.22% | (2,387) |
| 23/03/2027 | 7.80 | 179.38% | (2,264) |
| 29/11/2027 | 7.79 | 141.52% | (1,734) |
| 03/11/2028 | 7.79 | 116.57% | (1,618) |
| 26/02/2030 | 7.77 | 99.54% | (1,608) |
| 22/04/2031 | 7.79 | 95.65% | (1,826) |
| 23/03/2032 | 7.79 | 93.18% | (1,944) |
| 02/11/2035 | 7.75 | 90.07% | (1,893) |
| 23/03/2037 | 7.77 | 93.08% | (1,983) |
Closing Date: September 30, 2024
Lebanese Forex Market
| Last Price | Previous | % Change | |
| $/LBP | 89,500 | 89,500 | – |
| €/LBP | 99,711.95 | 99,649.30 | 0.06% |
| £/LBP | 119,733.10 | 119,661.50 | 0.06% |
| NEER | 229.97 | 229.88 | 0.04% |
Closing Date: October 01, 2024