
Discover today’s performance of BLOM indices, the closing prices of Lebanese stocks and Eurobonds, as well as the exchange rate of major currencies against the LBP.
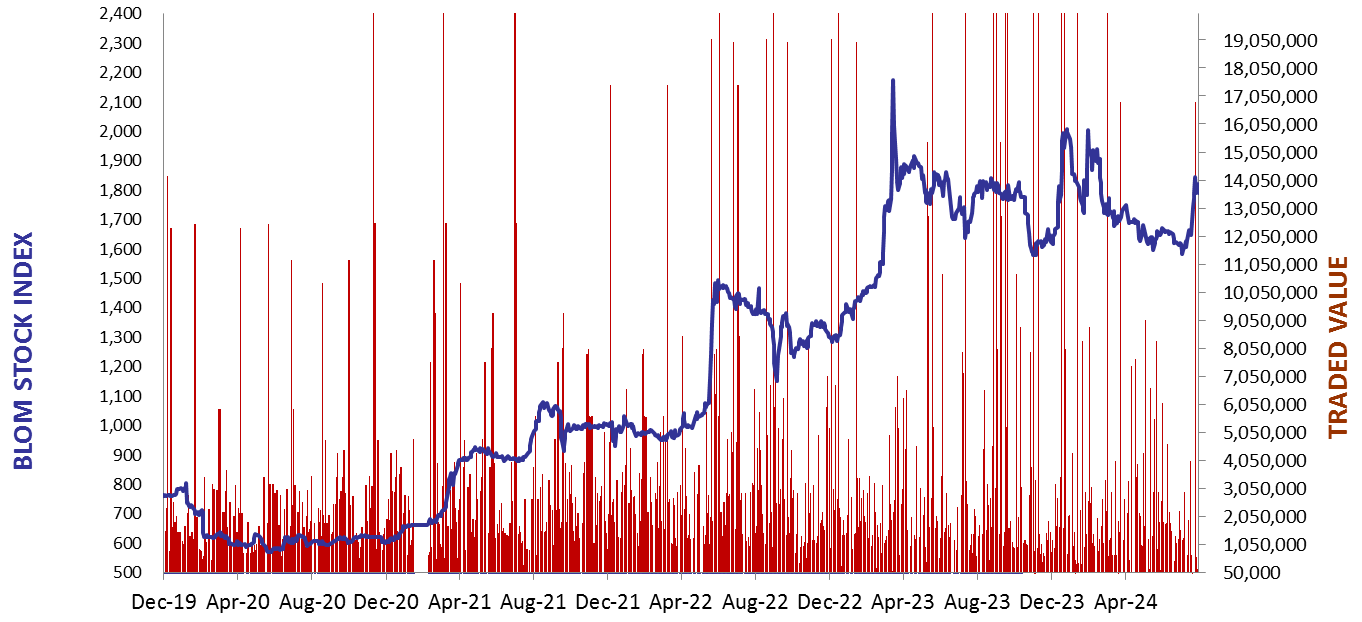
BLOM Stock Index (BSI) – today’s performance
| Last | Previous | % Change | Y-t-D Change | |
| BSI | 2,096.44 | 2,106.93 | -0.50% | 6.26% |
| High | 2,099.58 | 2,113.85 | ||
| Low | 2,094.41 | 2,098.56 | ||
| Volume | 13,078 | 21,203 | ||
| Val ($) | 895,995 | 1,815,116 |
I): BLOM preferred Shares Index (BPSI): today’s Performance
| Last | Previous | Change | |
| BPSI | 27.78 | 27.78 | 0.00% |
| Volume | |||
| Value |
Lebanese Stocks: today’s Trades and Closing Prices
| Last Price ($) | % Change | Volume | VWAP ($) | |
| Solidere A | 93.15 | -1.38% | 3,768 | 93.15 |
| Solidere B | 94.10 | 0.37% | 5,510 | 94.08 |
| BLOM – Listed Shares | 7.00 | 0.00% | 3,800 | 7.00 |
Closing Date: October 03, 2024
The BLOM Stock Index
BLOM BOND INDEX: Last Session’s Performance
| Last | Previous | Change | Y-t-D Change | ||
| BBI | 6.54 | 6.55 | -0.07% | 8.52% | |
| Weighted Yield | 211.44% | 210.06% | 137 | bps | |
| Duration (Years) | 1.53 | 1.54 | |||
| 5Y Bond Yield | 94.40% | 94.15% | 25 | bps | |
| 5Y Spread* | 9,043 | 9,019 | 24 | bps | |
| 10Y Bond Yield | 89.85% | 89.90% | -5 | bps | |
| 10Y Spread* | 8,631 | 8,638 | -7 | bps |
*spread between Lebanese Eurobonds and US Treasuries
| Price | Yield | Yield Change | |
| 12/06/2025 | 7.95 | 1025.44% | 1,484 |
| 28/11/2026 | 7.86 | 200.86% | 39 |
| 23/03/2027 | 7.86 | 178.75% | 33 |
| 29/11/2027 | 7.88 | 140.81% | 16 |
| 03/11/2028 | 7.86 | 116.02% | 29 |
| 26/02/2030 | 7.86 | 98.67% | (0) |
| 22/04/2031 | 7.83 | 95.39% | 37 |
| 23/03/2032 | 7.86 | 92.41% | (5) |
| 02/11/2035 | 7.86 | 88.99% | 8 |
| 23/03/2037 | 7.90 | 91.56% | (93) |
Closing Date: October 02, 2024
Lebanese Forex Market
| Last Price | Previous | % Change | |
| $/LBP | 89,500 | 89,500 | – |
| €/LBP | 98,673.75 | 98,852.75 | -0.18% |
| £/LBP | 117,969.95 | 118,739.65 | -0.65% |
| NEER | 230.26 | 230.14 | 0.05% |
Closing Date: October 03, 2024