
In this economic digest, we will tackle M2 from June 2021 to September 2024. The formula of M2 is as follows:
M2 = M1 + Other Deposits in LBP = Currency in Circulation + Demand Deposits in LBP + Other Deposits in LBP.
The M2 money supply is a significant economic indicator. It provides signs regarding the economy’s overall health, influencing inflation and economic growth. An increase in M2 can result in inflation and affects the purchasing power if it outperforms economic growth, as more money pursue the same amount of goods and services. A case in point is Lebanon, M2 increased rapidly while GDP decreased since 2019, as detailed thereafter. Development of M2, when managed properly, can fuel economic growth through rising lending and spending.
Central banks can manage M2 through several tools such as open market operations in which it injects or withdraws liquidity by buying or selling government securities. Another tool is adjusting reserve requirements. This tool influences banks’ ability to lend more money if reserve requirements were decreased, enhancing the growth of money supply. A third tool is adjusting interest rates – the discount rate — which will also affect borrowing and spending and accordingly money supply.
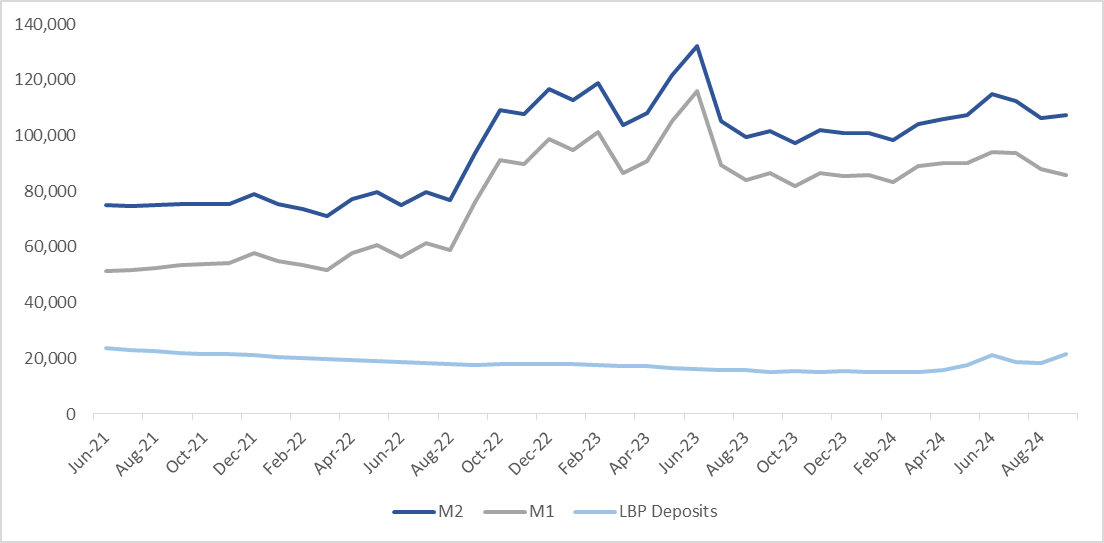
Sources: M1 and M2 from ABL Key Indicators and BDL Money Supply Releases
The graph above shows the change in M2 between June 2021 and September 2024 (in LBP Billions). A few findings can be drawn from it:
| Year | Average M2 (LBP Billions) | GDP (USD Billion) | Inflation |
| 2022 | 86,274 | 20.99 | 171.20% |
| 2023 | 108,595 | 17.94 | 221.30% |
Disclaimer:
This article is a research document that is owned and published by Blominvest Bank SAL.
No material from this publication may be modified, copied, reproduced, repackaged, republished, circulated, transmitted or redistributed directly or indirectly, in whole or in any part, without the prior written authorization of Blominvest Bank SAL.
The information and opinions contained in this document have been compiled from or arrived at in good faith from sources deemed reliable. Neither Blominvest Bank SAL, nor any of its subsidiaries or affiliates or parent company will make any representation or warranty to the accuracy or completeness of the information contained herein.
Neither the information nor any opinion expressed in this research article constitutes an offer or a recommendation to buy or sell any assets or securities, or to provide investment advice.
This research article is prepared for general circulation and is circulated for general information only.