
Discover today’s performance of BLOM indices, the closing prices of Lebanese stocks and Eurobonds, as well as the exchange rate of major currencies against the LBP.
BLOM Stock Index (BSI) – today’s performance
| Last | Previous | % Change | Y-t-D Change | |
| BSI | 2,131.21 | 2,092.38 | 1.86% | 8.02% |
| High | 2,155.27 | 2,095.63 | ||
| Low | 2,082.62 | 2,087.44 | ||
| Volume | 24,766 | 145 | ||
| Val ($) | 2,343,631 | 13,152 |
I): BLOM preferred Shares Index (BPSI): today’s Performance
| Last | Previous | Change | |
| BPSI | 27.78 | 27.78 | 0.00% |
| Volume | |||
| Value |
Lebanese Stocks: today’s Trades and Closing Prices
| Last Price ($) | % Change | Volume | VWAP ($) | |
| Solidere A | 94.60 | 0.64% | 23,551 | 94.56 |
| Solidere B | 95.90 | 5.73% | 1,215 | 95.92 |
Closing Date: October 17, 2024
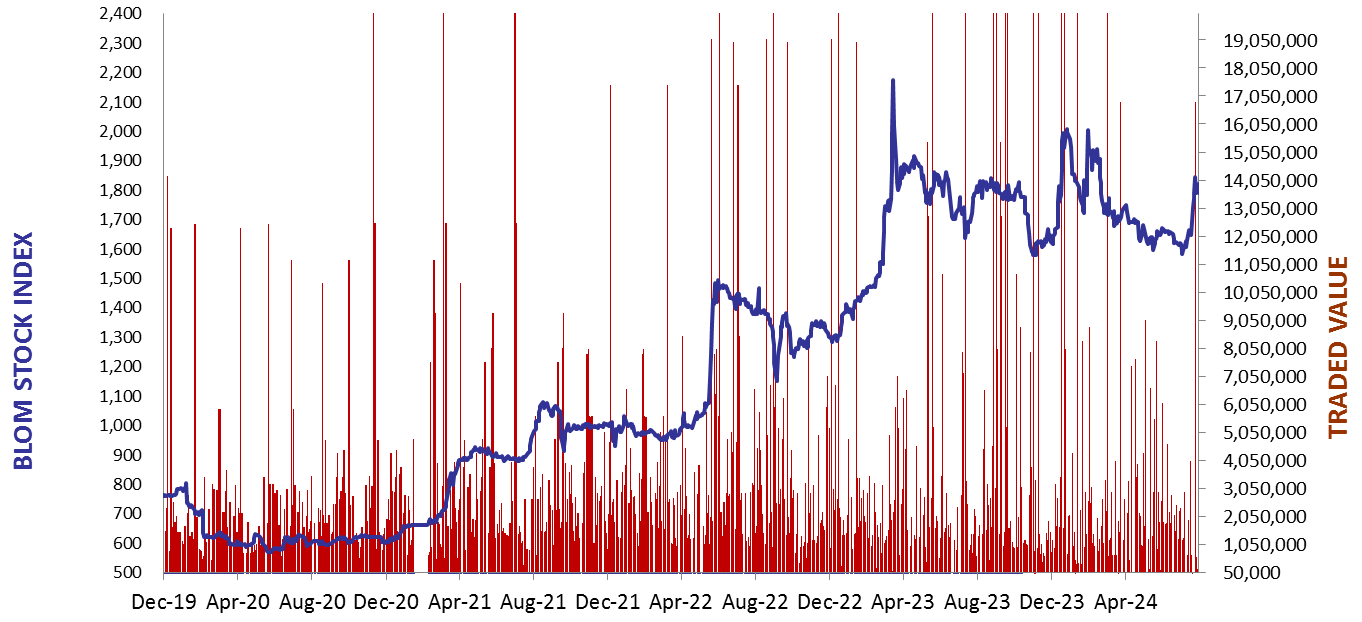
The BLOM Stock Index
BLOM BOND INDEX: Last Session’s Performance
| Last | Previous | Change | Y-t-D Change | ||
| BBI | 7.09 | 7.06 | 0.39% | 17.60% | |
| Weighted Yield | 211.15% | 210.46% | 68 | bps | |
| Duration (Years) | 1.56 | 1.56 | |||
| 5Y Bond Yield | 88.90% | 88.70% | 20 | bps | |
| 5Y Spread* | 8,473 | 8,452 | 21 | bps | |
| 10Y Bond Yield | 83.20% | 83.80% | -60 | bps | |
| 10Y Spread* | 7,936 | 7,994 | -58 | bps |
*spread between Lebanese Eurobonds and US Treasuries
| Price | Yield | Yield Change | |
| 12/06/2025 | 8.63 | 1082.02% | 1,127 |
| 28/11/2026 | 8.54 | 195.73% | (57) |
| 23/03/2027 | 8.51 | 172.38% | (20) |
| 29/11/2027 | 8.58 | 135.56% | (78) |
| 03/11/2028 | 8.56 | 111.06% | (53) |
| 26/02/2030 | 8.43 | 94.09% | 40 |
| 22/04/2031 | 8.51 | 89.81% | (13) |
| 23/03/2032 | 8.52 | 86.00% | (24) |
| 02/11/2035 | 8.55 | 82.35% | (63) |
| 23/03/2037 | 8.56 | 84.14% | (57) |
Closing Date: October 16, 2024
Lebanese Forex Market
| Last Price | Previous | % Change | |
| $/LBP | 89,500 | 89,500 | – |
| €/LBP | 97,134.35 | 97,205.95 | -0.07% |
| £/LBP | 116,224.70 | 116,260.50 | -0.03% |
| NEER | 230.69 | 230.66 | 0.01% |
Closing Date: October 17, 2024