
Discover today’s performance of BLOM indices, the closing prices of Lebanese stocks and Eurobonds, as well as the exchange rate of major currencies against the LBP.
BLOM Stock Index (BSI) – today’s performance
| Last | Previous | % Change | Y-t-D Change | |
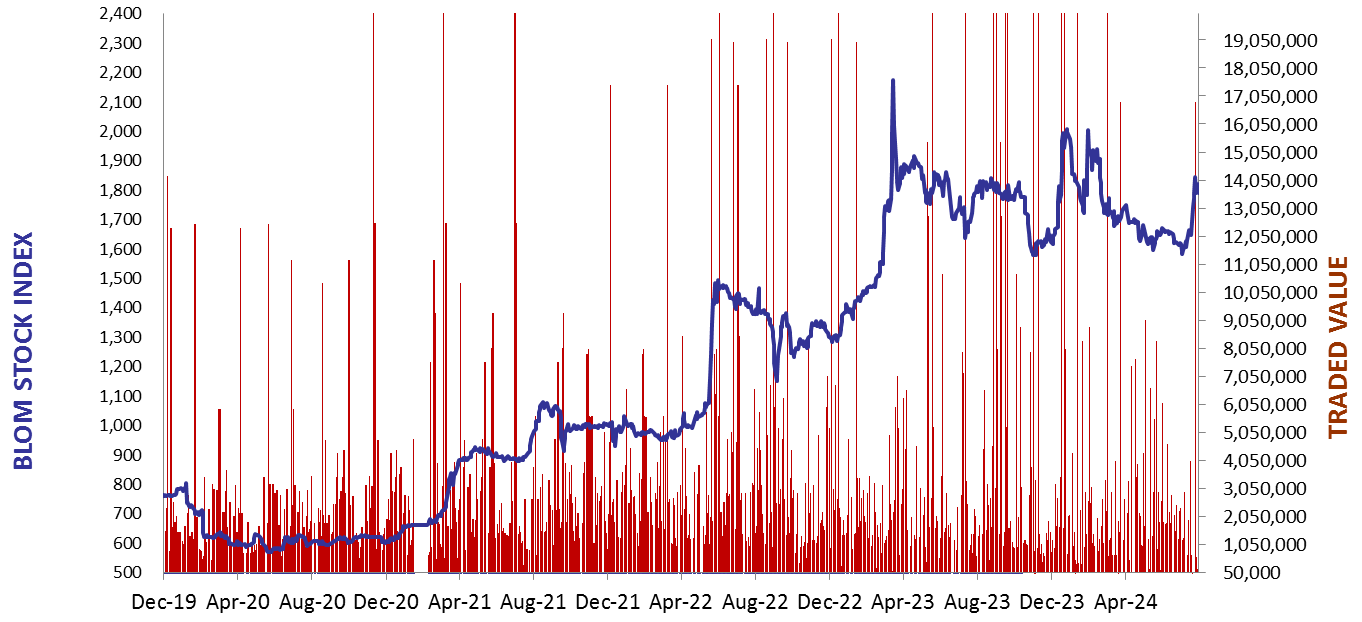
| BSI | 2,120.58 | 2,131.21 | -0.50% | 7.48% |
| High | 2,131.21 | 2,155.27 | ||
| Low | 2,116.69 | 2,082.62 | ||
| Volume | 2,512 | 24,766 | ||
| Val ($) | 237,222 | 2,343,631 |
I): BLOM preferred Shares Index (BPSI): today’s Performance
| Last | Previous | Change | |
| BPSI | 27.78 | 27.78 | 0.00% |
| Volume | |||
| Value |
Lebanese Stocks: today’s Trades and Closing Prices
| Last Price ($) | % Change | Volume | VWAP ($) | |
| Solidere A | 94.55 | -0.05% | 1,206 | 94.57 |
| Solidere B | 94.30 | -1.67% | 1,306 | 94.31 |
Closing Date: October 18, 2024
The BLOM Stock Index
BLOM BOND INDEX: Last Session’s Performance
| Last | Previous | Change | Y-t-D Change | ||
| BBI | 7.22 | 7.09 | 1.79% | 19.70% | |
| Weighted Yield | 209.09% | 211.15% | -206 | bps | |
| Duration (Years) | 1.57 | 1.56 | |||
| 5Y Bond Yield | 87.20% | 88.90% | -170 | bps | |
| 5Y Spread* | 8,299 | 8,473 | -270 | bps | |
| 10Y Bond Yield | 82.20% | 83.20% | -100 | bps | |
| 10Y Spread* | 7,831 | 7,936 | -200 | bps |
*spread between Lebanese Eurobonds and US Treasuries
| Price | Yield | Yield Change | |
| 12/06/2025 | 8.81 | 1072.46% | (955) |
| 28/11/2026 | 8.68 | 194.19% | (154) |
| 23/03/2027 | 8.64 | 171.05% | (133) |
| 29/11/2027 | 8.69 | 134.63% | (94) |
| 03/11/2028 | 8.69 | 110.07% | (99) |
| 26/02/2030 | 8.64 | 92.53% | (156) |
| 22/04/2031 | 8.66 | 88.57% | (124) |
| 23/03/2032 | 8.70 | 84.54% | (145) |
| 02/11/2035 | 8.68 | 81.25% | (111) |
| 23/03/2037 | 8.71 | 82.76% | (137) |
Closing Date: October 17, 2024
Lebanese Forex Market
| Last Price | Previous | % Change | |
| $/LBP | 89,500 | 89,500 | – |
| €/LBP | 97,018.00 | 96,937.45 | 0.08% |
| £/LBP | 118,587.50 | 116,439.50 | 1.84% |
| NEER | 230.76 | 230.69 | 0.03% |
Closing Date: October 18, 2024