
Discover today’s performance of BLOM indices, the closing prices of Lebanese stocks and Eurobonds, as well as the exchange rate of major currencies against the LBP.
BLOM Stock Index (BSI) – today’s performance
| Last | Previous | % Change | Y-t-D Change | |
| BSI | 2,187.29 | 2,141.02 | 2.16% | 10.86% |
| High | 2,189.63 | 2,142.92 | ||
| Low | 2,140.13 | 2,139.13 | ||
| Volume | 25,521 | 101,933 | ||
| Val ($) | 1,060,404 | 256,833 |
I): BLOM preferred Shares Index (BPSI): today’s Performance
| Last | Previous | Change | |
| BPSI | 27.78 | 27.78 | 0.00% |
| Volume | |||
| Value |
Lebanese Stocks: today’s Trades and Closing Prices
| Last Price ($) | % Change | Volume | VWAP ($) | |
| Solidere A | 99.40 | 4.63% | 7,221 | 96.40 |
| Solidere B | 98.00 | 0.31% | 3,200 | 97.28 |
| BLOM GDR | 3.51 | 6.04% | 15,100 | 3.50 |
Closing Date: October 22, 2024
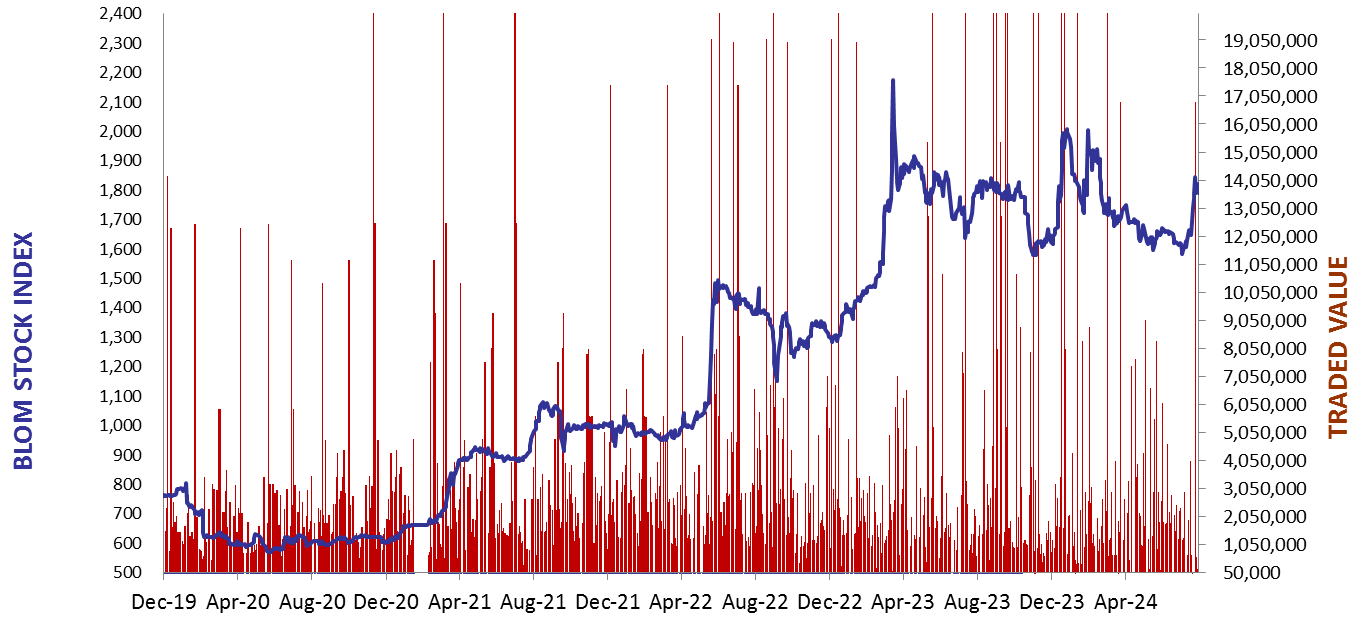
The BLOM Stock Index
BLOM BOND INDEX: Last Session’s Performance
| Last | Previous | Change | Y-t-D Change | ||
| BBI | 7.25 | 7.31 | -0.82% | 20.29% | |
| Weighted Yield | 212.30% | 208.30% | 400 | bps | |
| Duration (Years) | 1.56 | 1.58 | |||
| 5Y Bond Yield | 86.80% | 86.20% | 60 | bps | |
| 5Y Spread* | 8,256 | 8,201 | 55 | bps | |
| 10Y Bond Yield | 82.00% | 81.30% | 70 | bps | |
| 10Y Spread* | 7,805 | 7,744 | 61 | bps |
*spread between Lebanese Eurobonds and US Treasuries
| Price | Yield | Yield Change | |
| 12/06/2025 | 8.85 | 1109.16% | 3,487 |
| 28/11/2026 | 8.72 | 194.83% | 148 |
| 23/03/2027 | 8.64 | 171.59% | 245 |
| 29/11/2027 | 8.73 | 134.76% | 96 |
| 03/11/2028 | 8.74 | 109.94% | 79 |
| 26/02/2030 | 8.74 | 91.84% | 34 |
| 22/04/2031 | 8.71 | 88.35% | 98 |
| 23/03/2032 | 8.71 | 84.43% | 56 |
| 02/11/2035 | 8.71 | 81.12% | 71 |
| 23/03/2037 | 8.76 | 82.23% | 47 |
Closing Date: October 21, 2024
Lebanese Forex Market
| Last Price | Previous | % Change | |
| $/LBP | 89,500 | 89,500 | – |
| €/LBP | 96,839.00 | 96,794.25 | 0.05% |
| £/LBP | 116,350.00 | 116,206.80 | 0.12% |
| NEER | 230.87 | 230.82 | 0.02% |
Closing Date: October 22, 2024