
Discover today’s performance of BLOM indices, the closing prices of Lebanese stocks and Eurobonds, as well as the exchange rate of major currencies against the LBP.
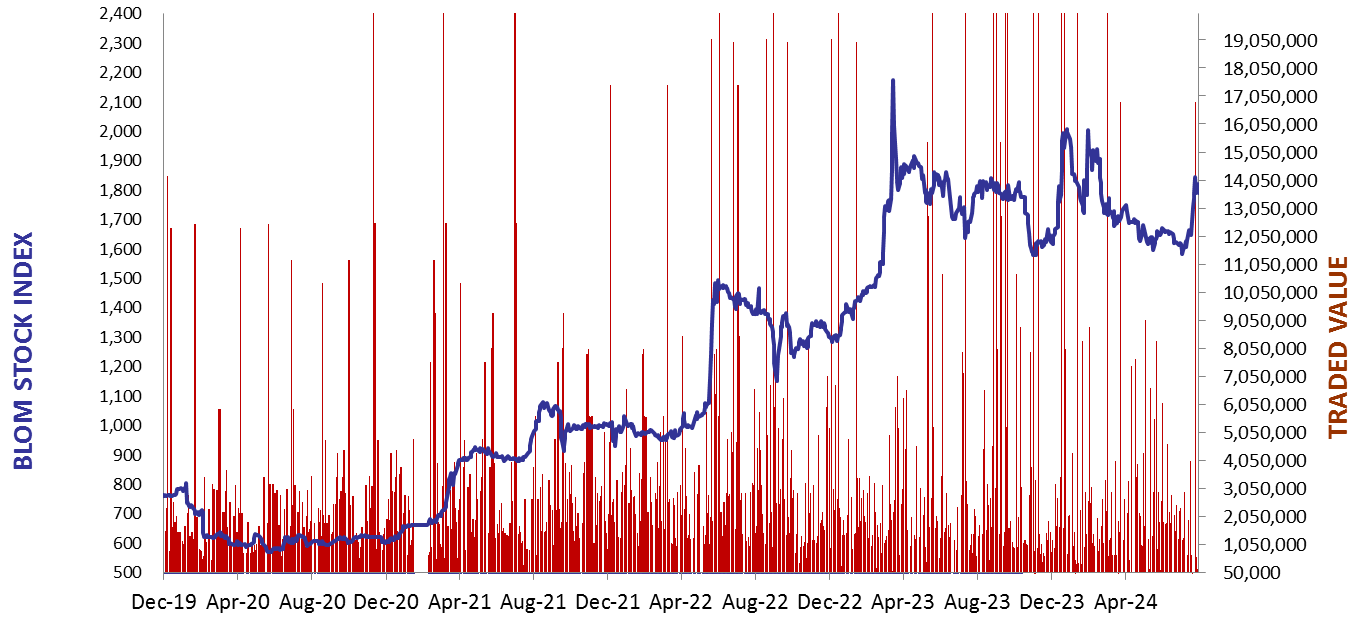
BLOM Stock Index (BSI) – today’s performance
| Last | Previous | % Change | Y-t-D Change | |
| BSI | 2,158.13 | 2,150.21 | 0.37% | 9.38% |
| High | 2,158.13 | 2,186.55 | ||
| Low | 2,147.72 | 2,144.69 | ||
| Volume | 2,690 | 21,235 | ||
| Val ($) | 262,326 | 612,473 |
I): BLOM preferred Shares Index (BPSI): today’s Performance
| Last | Previous | Change | |
| BPSI | 27.78 | 27.78 | 0.00% |
| Volume | |||
| Value |
Lebanese Stocks: today’s Trades and Closing Prices
| Last Price ($) | % Change | Volume | VWAP ($) | |
| Solidere A | 98.35 | 2.02% | 2,190 | 98.37 |
| Solidere B | 93.80 | -1.83% | 500 | 93.80 |
Closing Date: October 25, 2024
The BLOM Stock Index
BLOM BOND INDEX: Last Session’s Performance
| Last | Previous | Change | Y-t-D Change | ||
| BBI | 7.08 | 7.14 | -0.88% | 17.39% | |
| Weighted Yield | 218.84% | 216.93% | 191 | bps | |
| Duration (Years) | 1.55 | 1.56 | |||
| 5Y Bond Yield | 88.90% | 88.00% | 90 | bps | |
| 5Y Spread* | 8,465 | 8,373 | 92 | bps | |
| 10Y Bond Yield | 83.70% | 83.40% | 30 | bps | |
| 10Y Spread* | 7,968 | 7,937 | 31 | bps |
*spread between Lebanese Eurobonds and US Treasuries
| Price | Yield | Yield Change | |
| 12/06/2025 | 8.69 | 1159.18% | 1,202 |
| 28/11/2026 | 8.52 | 198.52% | 212 |
| 23/03/2027 | 8.49 | 173.86% | 88 |
| 29/11/2027 | 8.51 | 137.23% | 30 |
| 03/11/2028 | 8.53 | 111.96% | 9 |
| 26/02/2030 | 8.46 | 93.98% | 95 |
| 22/04/2031 | 8.52 | 89.94% | 45 |
| 23/03/2032 | 8.48 | 86.28% | 108 |
| 02/11/2035 | 8.51 | 83.04% | 18 |
| 23/03/2037 | 8.53 | 84.30% | 64 |
Closing Date: October 24, 2024
Lebanese Forex Market
| Last Price | Previous | % Change | |
| $/LBP | 89,500 | 89,500 | – |
| €/LBP | 96,883.75 | 96,901.65 | -0.02% |
| £/LBP | 116,036.75 | 116,099.40 | -0.05% |
| NEER | 230.95 | 230.90 | 0.02% |
Closing Date: October 25, 2024