
Discover today’s performance of BLOM indices, the closing prices of Lebanese stocks and Eurobonds, as well as the exchange rate of major currencies against the LBP.
BLOM Stock Index (BSI) – today’s performance
| Last | Previous | % Change | Y-t-D Change | |
| BSI | 2,152.08 | 2,140.21 | 0.56% | 9.08% |
| High | 2,173.55 | 2,203.43 | ||
| Low | 2,140.21 | 2,123.62 | ||
| Volume | 9,052 | 11,660 | ||
| Val ($) | 532,031 | 1,113,608 |
I): BLOM preferred Shares Index (BPSI): today’s Performance
| Last | Previous | Change | |
| BPSI | 27.78 | 27.78 | 0.00% |
| Volume | |||
| Value |
Lebanese Stocks: today’s Trades and Closing Prices
| Last Price ($) | % Change | Volume | VWAP ($) | |
| Solidere A | 96.30 | 0.63% | 4,011 | 96.31 |
| Solidere B | 96.00 | 1.00% | 1,241 | 96.00 |
| BLOM – Listed Shares | 7.00 | 0.00% | 3,800 | 7.00 |
Closing Date: October 30, 2024
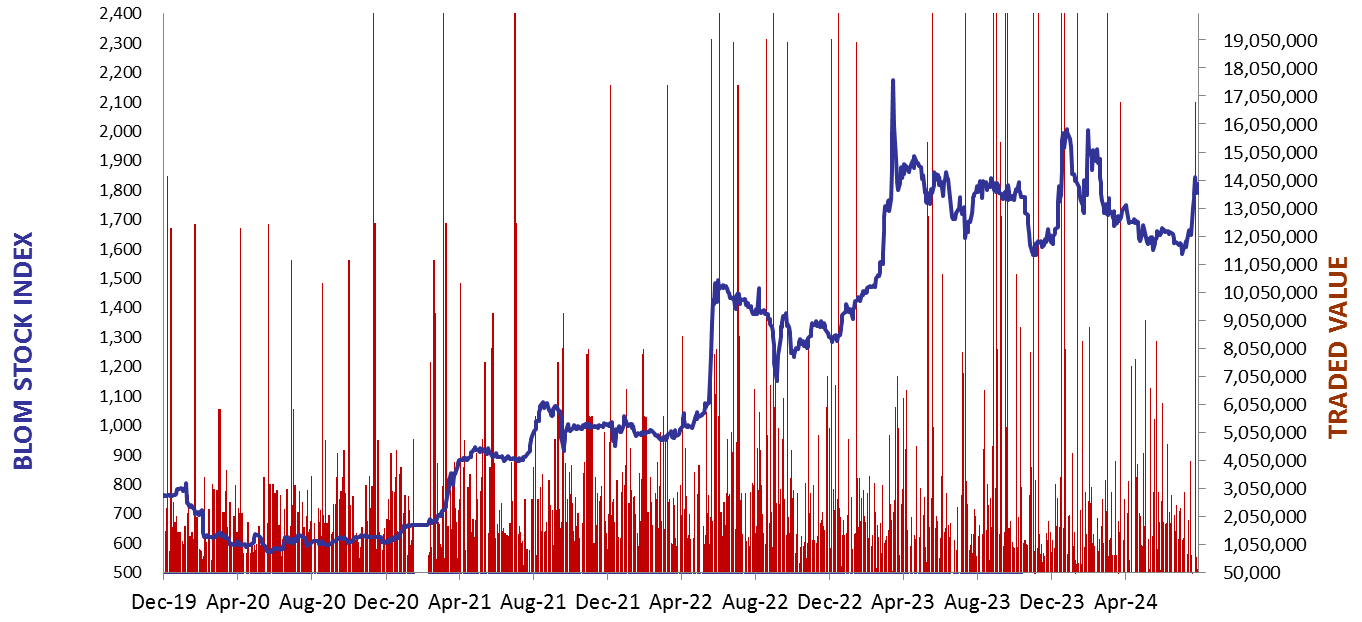
The BLOM Stock Index
BLOM BOND INDEX: Last Session’s Performance
| Last | Previous | Change | Y-t-D Change | ||
| BBI | 7.01 | 7.02 | -0.09% | 16.31% | |
| Weighted Yield | 226.26% | 224.94% | 132 | bps | |
| Duration (Years) | 1.52 | 1.53 | |||
| 5Y Bond Yield | 89.30% | 89.20% | 10 | bps | |
| 5Y Spread* | 8,501 | 8,492 | 9 | bps | |
| 10Y Bond Yield | 85.00% | 84.50% | 50 | bps | |
| 10Y Spread* | 8,092 | 8,041 | 51 | bps |
*spread between Lebanese Eurobonds and US Treasuries
| Price | Yield | Yield Change | |
| 12/06/2025 | 8.59 | 1230.37% | 1,344 |
| 28/11/2026 | 8.45 | 201.30% | 22 |
| 23/03/2027 | 8.43 | 175.37% | (10) |
| 29/11/2027 | 8.42 | 138.78% | 28 |
| 03/11/2028 | 8.42 | 113.28% | 20 |
| 26/02/2030 | 8.41 | 94.45% | 9 |
| 22/04/2031 | 8.47 | 90.27% | (26) |
| 23/03/2032 | 8.39 | 87.00% | 45 |
| 02/11/2035 | 8.39 | 84.31% | 29 |
| 23/03/2037 | 8.46 | 84.88% | 13 |
Closing Date: October 29, 2024
Lebanese Forex Market
| Last Price | Previous | % Change | |
| $/LBP | 89,500 | 89,500 | – |
| €/LBP | 96,955.35 | 96,821.10 | 0.14% |
| £/LBP | 116,072.55 | 116,484.25 | -0.35% |
| NEER | 230.95 | 230.76 | 0.08% |
Closing Date: October 30, 2024