
Discover today’s performance of BLOM indices, the closing prices of Lebanese stocks and Eurobonds, as well as the exchange rate of major currencies against the LBP.
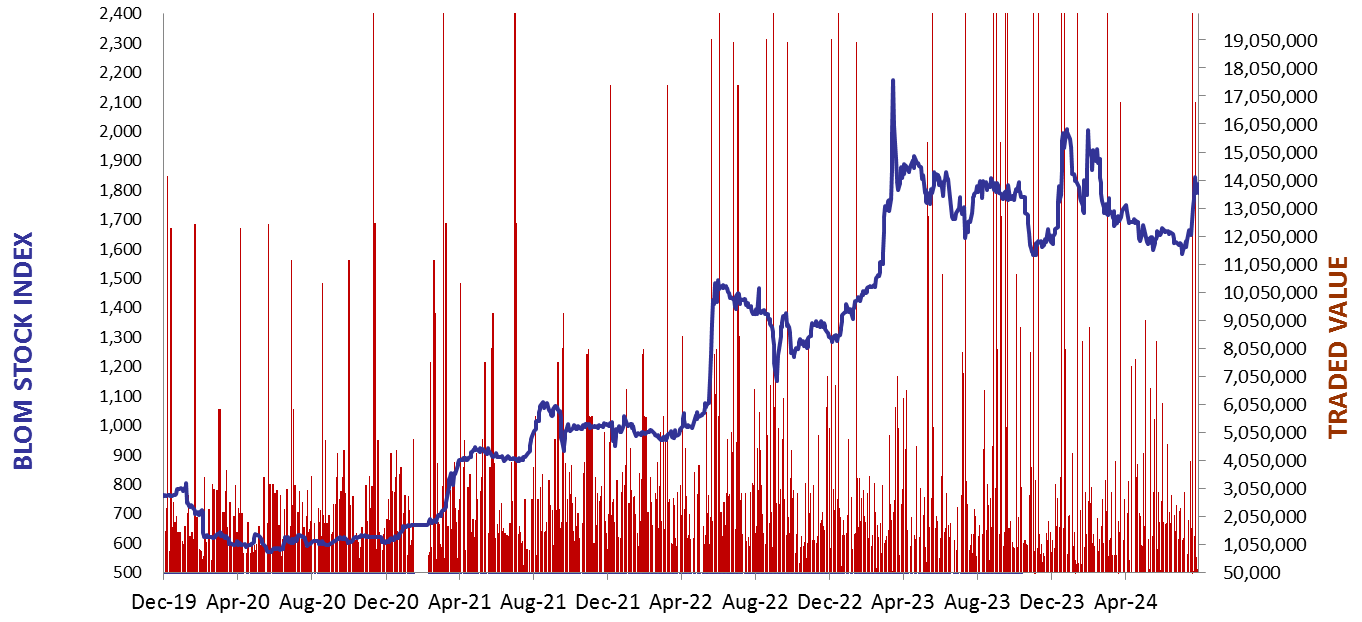
BLOM Stock Index (BSI) – today’s performance
| Last | Previous | % Change | Y-t-D Change | |
| BSI | 2,154.59 | 2,143.13 | 0.53% | 9.20% |
| High | 2,182.72 | 2,143.37 | ||
| Low | 2,131.24 | 2,124.35 | ||
| Volume | 4,641 | 23,956 | ||
| Val ($) | 442,006 | 1,325,608 |
I): BLOM preferred Shares Index (BPSI): today’s Performance
| Last | Previous | Change | |
| BPSI | 27.78 | 27.78 | 0.00% |
| Volume | |||
| Value |
Lebanese Stocks: today’s Trades and Closing Prices
| Last Price ($) | % Change | Volume | VWAP ($) | |
| Solidere A | 95.00 | -0.47% | 3,530 | 95.00 |
| Solidere B | 96.00 | 2.67% | 1,111 | 96.00 |
Closing Date: November 7, 2024
The BLOM Stock Index
BLOM BOND INDEX: Last Session’s Performance
| Last | Previous | Change | Y-t-D Change | ||
| BBI | 6.94 | 6.97 | -0.45% | 15.12% | |
| Weighted Yield | 237.16% | 234.80% | 236 | bps | |
| Duration (Years) | 1.56 | 1.56 | |||
| 5Y Bond Yield | 90.30% | 89.90% | 40 | bps | |
| 5Y Spread* | 8,599 | 8,563 | 36 | bps | |
| 10Y Bond Yield | 86.00% | 85.80% | 20 | bps | |
| 10Y Spread* | 8,180 | 8,169 | 11 | bps |
*spread between Lebanese Eurobonds and US Treasuries
| Price | Yield | Yield Change | |
| 12/06/2025 | 8.49 | 1338.25% | 2,227 |
| 28/11/2026 | 8.37 | 204.97% | 118 |
| 23/03/2027 | 8.35 | 177.44% | (13) |
| 29/11/2027 | 8.37 | 140.27% | 31 |
| 03/11/2028 | 8.38 | 114.12% | 28 |
| 26/02/2030 | 8.29 | 95.53% | 88 |
| 22/04/2031 | 8.26 | 92.03% | 147 |
| 23/03/2032 | 8.33 | 87.44% | (47) |
| 02/11/2035 | 8.27 | 85.46% | 42 |
| 23/03/2037 | 8.38 | 85.53% | 42 |
Closing Date: November 6, 2024
Lebanese Forex Market
| Last Price | Previous | % Change | |
| $/LBP | 89,500 | 89,500 | – |
| €/LBP | 96,176.70 | 96,015.60 | 0.17% |
| £/LBP | 115,714.55 | 115,258.10 | 0.40% |
| NEER | 231.16 | 231.21 | -0.02% |
Closing Date: November 7, 2024