
Discover today’s performance of BLOM indices, the closing prices of Lebanese stocks and Eurobonds, as well as the exchange rate of major currencies against the LBP.
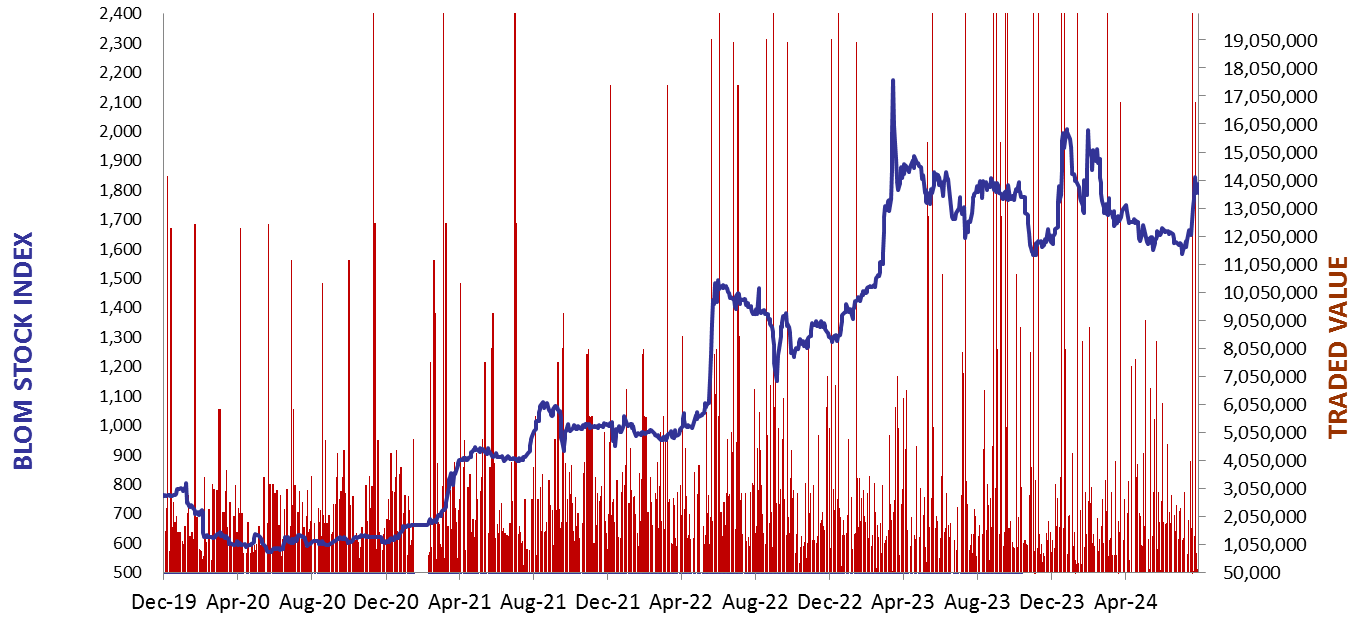
BLOM Stock Index (BSI) – today’s performance
| Last | Previous | % Change | Y-t-D Change | |
| BSI | 2,161.91 | 2,154.59 | 0.34% | 9.58% |
| High | 2,173.79 | 2,182.72 | ||
| Low | 2,154.59 | 2,131.24 | ||
| Volume | 7,522 | 4,641 | ||
| Val ($) | 719,970 | 442,006 |
I): BLOM preferred Shares Index (BPSI): today’s Performance
| Last | Previous | Change | |
| BPSI | 27.78 | 27.78 | 0.00% |
| Volume | |||
| Value |
Lebanese Stocks: today’s Trades and Closing Prices
| Last Price ($) | % Change | Volume | VWAP ($) | |
| Solidere A | 95.75 | 0.79% | 4,500 | 95.54 |
| Solidere B | 96.00 | 0.00% | 3,022 | 95.98 |
Closing Date: November 8, 2024
The BLOM Stock Index
BLOM BOND INDEX: Last Session’s Performance
| Last | Previous | Change | Y-t-D Change | ||
| BBI | 6.97 | 6.94 | 0.43% | 15.61% | |
| Weighted Yield | 237.40% | 237.16% | 24 | bps | |
| Duration (Years) | 1.56 | 1.56 | |||
| 5Y Bond Yield | 89.80% | 90.30% | -50 | bps | |
| 5Y Spread* | 8,552 | 8,599 | -47 | bps | |
| 10Y Bond Yield | 85.40% | 86.00% | -60 | bps | |
| 10Y Spread* | 8,127 | 8,180 | -53 | bps |
*spread between Lebanese Eurobonds and US Treasuries
| Price | Yield | Yield Change | |
| 12/06/2025 | 8.57 | 1342.79% | 455 |
| 28/11/2026 | 8.38 | 205.18% | 20 |
| 23/03/2027 | 8.34 | 177.78% | 34 |
| 29/11/2027 | 8.38 | 140.34% | 7 |
| 03/11/2028 | 8.38 | 114.09% | (3) |
| 26/02/2030 | 8.37 | 94.89% | (64) |
| 22/04/2031 | 8.42 | 90.56% | (147) |
| 23/03/2032 | 8.34 | 87.31% | (13) |
| 02/11/2035 | 8.37 | 84.47% | (99) |
| 23/03/2037 | 8.40 | 85.31% | (21) |
Closing Date: November 7, 2024
Lebanese Forex Market
| Last Price | Previous | % Change | |
| $/LBP | 89,500 | 89,500 | – |
| €/LBP | 96,436.25 | 96,695.80 | -0.27% |
| £/LBP | 116,027.80 | 116,224.70 | -0.17% |
| NEER | 231.30 | 231.16 | 0.06% |
Closing Date: November 8, 2024