
Discover today’s performance of BLOM indices, the closing prices of Lebanese stocks and Eurobonds, as well as the exchange rate of major currencies against the LBP.
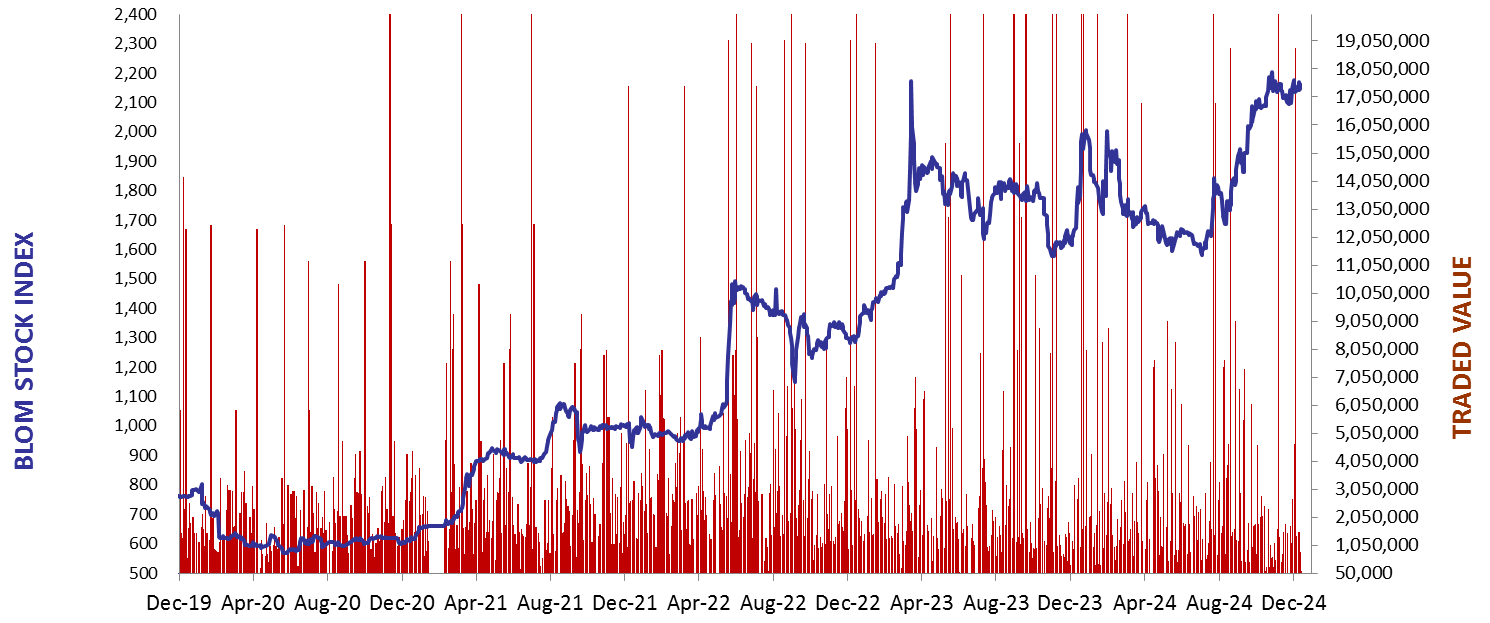
BLOM Stock Index (BSI) – today’s performance
| Last | Previous | % Change | Y-t-D Change | |
| BSI | 2,163.00 | 2,145.87 | 0.80% | 9.63% |
| High | 2,164.11 | 2,184.80 | ||
| Low | 2,142.94 | 2,137.47 | ||
| Volume | 126,296 | 187,344 | ||
| Val ($) | 1,141,198 | 630,586 |
I): BLOM preferred Shares Index (BPSI): today’s Performance
| Last | Previous | Change | |
| BPSI | 27.78 | 27.78 | 0.00% |
| Volume | |||
| Value |
Lebanese Stocks: today’s Trades and Closing Prices
| Last Price ($) | % Change | Volume | VWAP ($) | |
| Solidere A | 92.00 | 0.44% | 6,060 | 92.00 |
| Solidere B | 92.00 | 2.22% | 5,000 | 92.00 |
| Byblos Bank – Listed Shares | 1.07 | 0.94% | 115,236 | 1.10 |
Closing Date: December 13, 2024
The BLOM Stock Index
BLOM BOND INDEX: Last Session’s Performance
| Last | Previous | Change | Y-t-D Change | ||
| BBI | 12.92 | 13.06 | -1.02% | 106.98% | |
| Weighted Yield | 104.23% | 103.40% | 83 | bps | |
| Duration (Years) | 2.10 | 2.11 | |||
| 5Y Bond Yield | 105.60% | 104.60% | 100 | bps | |
| 5Y Spread* | 10,138 | 10,039 | 99 | bps | |
| 10Y Bond Yield | 77.60% | 77.00% | 60 | bps | |
| 10Y Spread* | 7,346 | 7,291 | 55 | bps |
*spread between Lebanese Eurobonds and US Treasuries
| Price | Yield | Yield Change | |
| 28/11/2026 | 12.44 | 169.87% | 159 |
| 23/03/2027 | 12.47 | 144.64% | 108 |
| 29/11/2027 | 12.47 | 113.40% | 84 |
| 03/11/2028 | 12.48 | 89.77% | 62 |
| 26/02/2030 | 12.49 | 73.23% | 48 |
| 22/04/2031 | 12.51 | 67.42% | 37 |
| 23/03/2032 | 12.46 | 63.70% | 54 |
| 02/11/2035 | 12.52 | 57.58% | 34 |
| 23/03/2037 | 12.51 | 58.20% | 51 |
Closing Date: December 12, 2024
Lebanese Forex Market
| Last Price | Previous | % Change | |
| $/LBP | 89,500 | 89,500 | – |
| €/LBP | 93,625.95 | 93,679.65 | -0.06% |
| £/LBP | 113,011.65 | 113,396.50 | -0.34% |
| NEER | 233.32 | 233.21 | 0.05% |
Closing Date: December 13, 2024