
Discover today’s performance of BLOM indices, the closing prices of Lebanese stocks and Eurobonds, as well as the exchange rate of major currencies against the LBP.
BLOM Stock Index (BSI) – today’s performance
| Last | Previous | % Change | Y-t-D Change | |
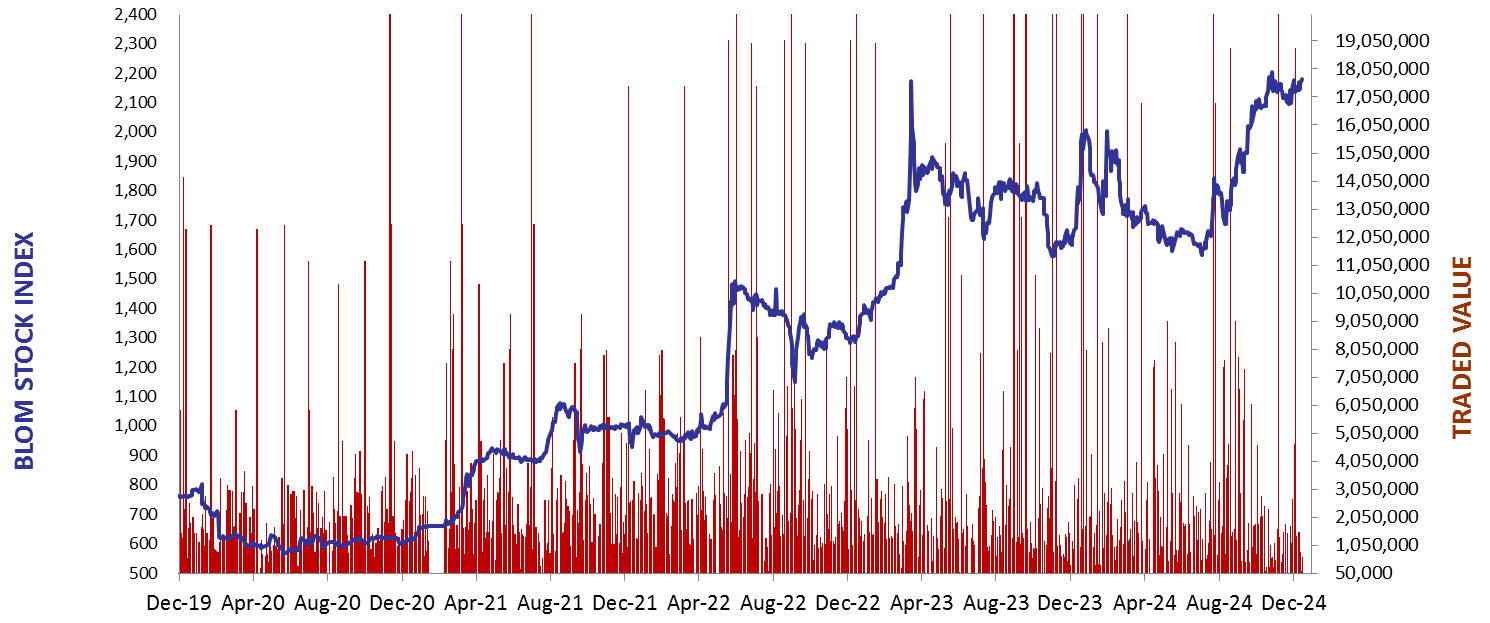
| BSI | 2,180.01 | 2,163.00 | 0.79% | 10.49% |
| High | 2,214.85 | 2,164.11 | ||
| Low | 2,137.60 | 2,142.94 | ||
| Volume | 83,490 | 126,296 | ||
| Val ($) | 7,778,474 | 1,141,198 |
I): BLOM preferred Shares Index (BPSI): today’s Performance
| Last | Previous | Change | |
| BPSI | 27.78 | 27.78 | 0.00% |
| Volume | |||
| Value |
Lebanese Stocks: today’s Trades and Closing Prices
| Last Price ($) | % Change | Volume | VWAP ($) | |
| Solidere A | 91.95 | -0.05% | 44,300 | 93.75 |
| Solidere B | 94.15 | 2.34% | 38,500 | 94.15 |
| Byblos Bank – Listed Shares | 1.14 | 6.54% | 690 | 1.10 |
Closing Date: December 16, 2024
The BLOM Stock Index
BLOM BOND INDEX: Last Session’s Performance
| Last | Previous | Change | Y-t-D Change | ||
| BBI | 12.88 | 12.92 | -0.31% | 106.34% | |
| Weighted Yield | 104.50% | 104.23% | 27 | bps | |
| Duration (Years) | 2.09 | 2.10 | |||
| 5Y Bond Yield | 105.80% | 105.60% | 20 | bps | |
| 5Y Spread* | 10,156 | 10,138 | 18 | bps | |
| 10Y Bond Yield | 77.70% | 77.60% | 10 | bps | |
| 10Y Spread* | 7,349 | 7,346 | 3 | bps |
*spread between Lebanese Eurobonds and US Treasuries
| Price | Yield | Yield Change | |
| 28/11/2026 | 12.42 | 170.28% | 40 |
| 23/03/2027 | 12.46 | 144.87% | 24 |
| 29/11/2027 | 12.44 | 113.64% | 24 |
| 03/11/2028 | 12.44 | 89.95% | 18 |
| 26/02/2030 | 12.43 | 73.48% | 25 |
| 22/04/2031 | 12.45 | 67.66% | 25 |
| 23/03/2032 | 12.44 | 63.78% | 8 |
| 02/11/2035 | 12.44 | 57.93% | 34 |
| 23/03/2037 | 12.41 | 58.63% | 42 |
Closing Date: December 13, 2024
Lebanese Forex Market
| Last Price | Previous | % Change | |
| $/LBP | 89,500 | 89,500 | – |
| €/LBP | 94,055.55 | 93,992.90 | 0.07% |
| £/LBP | 113,056.40 | 112,931.10 | 0.11% |
| NEER | 233.32 | 233.32 | 0.00% |
Closing Date: December 16, 2024