
Discover today’s performance of BLOM indices, the closing prices of Lebanese stocks and Eurobonds, as well as the exchange rate of major currencies against the LBP.
BLOM Stock Index (BSI) – today’s performance
| Last | Previous | % Change | Y-t-D Change | |
| BSI | 2,438.39 | 2,627.55 | -7.20% | -7.20% |
| High | 2,522.64 | 2,670.43 | ||
| Low | 2,385.79 | 2,517.26 | ||
| Volume | 21,606 | 70,347 | ||
| Val ($) | 2,365,899 | 5,593,793 |
I): BLOM preferred Shares Index (BPSI): today’s Performance
| Last | Previous | Change | |
| BPSI | 27.52 | 27.52 | 0.00% |
| Volume | |||
| Value |
Lebanese Stocks: today’s Trades and Closing Prices
| Last Price ($) | % Change | Volume | VWAP ($) | |
| Solidere A | 107.00 | -10.83% | 16,121 | 109.67 |
| Solidere B | 109.90 | -8.03% | 5,335 | 110.94 |
| CB (N) | 40.00 | -3.92% | 150 | 40.00 |
Closing Date: January 2, 2025
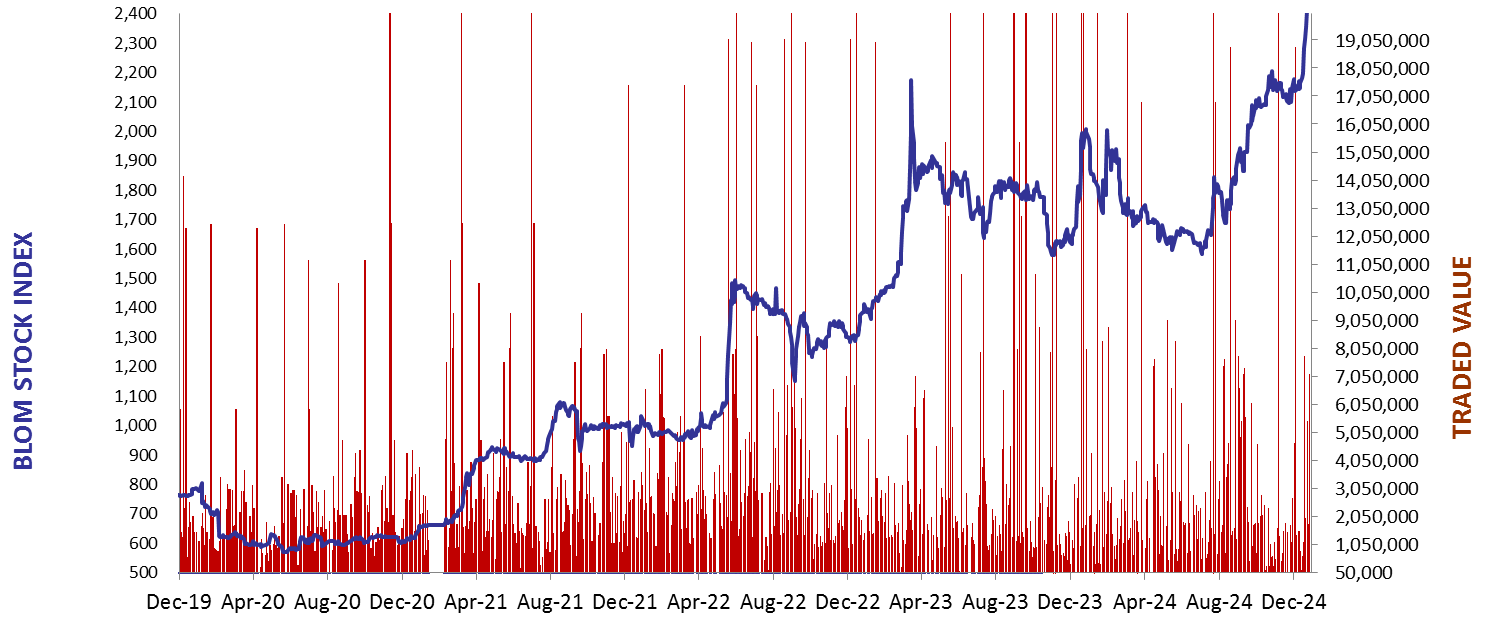
The BLOM Stock Index
BLOM BOND INDEX: Last Session’s Performance
| Last | Previous | Change | Y-t-D Change | ||
| BBI | 13.26 | 13.29 | -0.25% | -0.25% | |
| Weighted Yield | 104.06% | 103.56% | 50 | bps | |
| Duration (Years) | 2.06 | 2.08 | |||
| 5Y Bond Yield | 105.20% | 105.00% | 20 | bps | |
| 5Y Spread* | 10,082 | 10,080 | 2 | bps | |
| 10Y Bond Yield | 76.80% | 76.60% | 20 | bps | |
| 10Y Spread* | 7,222 | 7,224 | -2 | bps |
*spread between Lebanese Eurobonds and US Treasuries
| Price | Yield | Yield Change | |
| 28/11/2026 | 12.82 | 170.92% | 88 |
| 23/03/2027 | 12.79 | 145.71% | 88 |
| 29/11/2027 | 12.80 | 112.98% | 40 |
| 03/11/2028 | 12.78 | 89.20% | 35 |
| 26/02/2030 | 12.80 | 72.52% | 24 |
| 22/04/2031 | 12.86 | 66.28% | (11) |
| 23/03/2032 | 12.76 | 62.75% | 40 |
| 02/11/2035 | 12.77 | 56.54% | 16 |
| 23/03/2037 | 12.78 | 57.06% | 38 |
Closing Date: January 1, 2025
Lebanese Forex Market
| Last Price | Previous | % Change | |
| $/LBP | 89,500 | 89,500 | – |
| €/LBP | 92,543.00 | 92,677.25 | -0.14% |
| £/LBP | 111,436.45 | 112,027.15 | -0.53% |
| NEER | 235.09 | 234.21 | 0.38% |
Closing Date: January 2, 2025