
Discover today’s performance of BLOM indices, the closing prices of Lebanese stocks and Eurobonds, as well as the exchange rate of major currencies against the LBP.
BLOM Stock Index (BSI) – today’s performance
| Last | Previous | % Change | Y-t-D Change | |
| BSI | 2,595.98 | 2,438.39 | 6.46% | -1.20% |
| High | 2,653.19 | 2,522.64 | ||
| Low | 2,542.78 | 2,385.79 | ||
| Volume | 81,527 | 21,606 | ||
| Val ($) | 1,904,664 | 2,365,899 |
I): BLOM preferred Shares Index (BPSI): today’s Performance
| Last | Previous | Change | |
| BPSI | 27.52 | 27.52 | 0.00% |
| Volume | |||
| Value |
Lebanese Stocks: today’s Trades and Closing Prices
| Last Price ($) | % Change | Volume | VWAP ($) | |
| Solidere A | 118.00 | 10.28% | 11,875 | 110.46 |
| Solidere B | 118.00 | 7.37% | 4,652 | 111.39 |
| Byblos bank – Listed Shares | 1.15 | -1.71% | 65,000 | 1.20 |
Closing Date: January 3, 2025
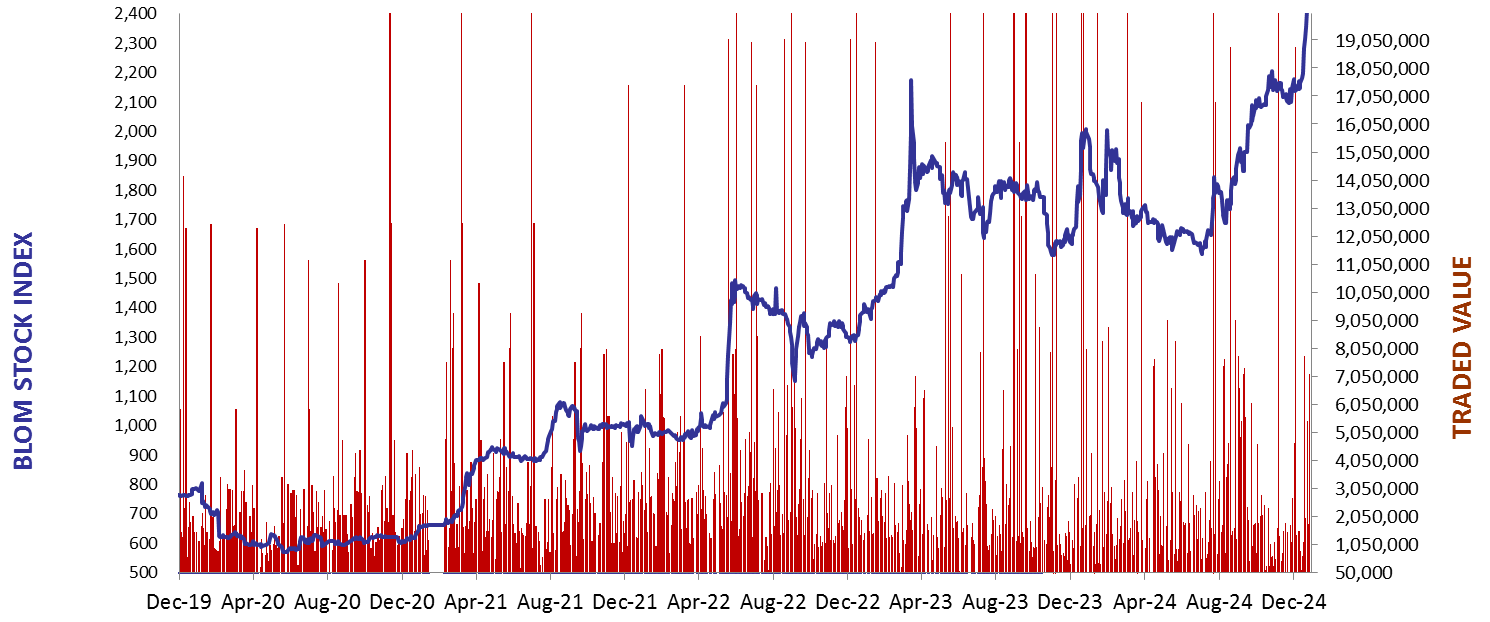
The BLOM Stock Index
BLOM BOND INDEX: Last Session’s Performance
| Last | Previous | Change | Y-t-D Change | ||
| BBI | 13.57 | 13.26 | 2.37% | 2.11% | |
| Weighted Yield | 102.58% | 104.06% | -148 | bps | |
| Duration (Years) | 2.09 | 2.06 | |||
| 5Y Bond Yield | 103.60% | 105.20% | -160 | bps | |
| 5Y Spread* | 9,922 | 10,082 | -160 | bps | |
| 10Y Bond Yield | 75.60% | 76.80% | -120 | bps | |
| 10Y Spread* | 7,103 | 7,222 | -119 | bps |
*spread between Lebanese Eurobonds and US Treasuries
| Price | Yield | Yield Change | |
| 28/11/2026 | 13.07 | 169.05% | (187) |
| 23/03/2027 | 13.04 | 144.09% | (162) |
| 29/11/2027 | 13.12 | 111.30% | (168) |
| 03/11/2028 | 13.14 | 87.67% | (152) |
| 26/02/2030 | 13.08 | 71.54% | (98) |
| 22/04/2031 | 13.16 | 65.21% | (107) |
| 23/03/2032 | 13.14 | 61.38% | (137) |
| 02/11/2035 | 13.19 | 54.93% | (160) |
| 23/03/2037 | 13.09 | 55.81% | (125) |
Closing Date: January 2, 2025
Lebanese Forex Market
| Last Price | Previous | % Change | |
| $/LBP | 89,500 | 89,500 | – |
| €/LBP | 92,041.80 | 91,871.75 | 0.19% |
| £/LBP | 110,908.40 | 110,801.00 | 0.10% |
| NEER | 235.15 | 235.09 | 0.02% |
Closing Date: January 3, 2025