
Discover today’s performance of BLOM indices, the closing prices of Lebanese stocks and Eurobonds, as well as the exchange rate of major currencies against the LBP.
BLOM Stock Index (BSI) – today’s performance
| Last | Previous | % Change | Y-t-D Change | |
| BSI | 2,445.04 | 2,463.58 | -0.75% | -6.95% |
| Volume | 8,329 | 9,907 | ||
| Val ($) | 786,816 | 1,026,001 |
I): BLOM preferred Shares Index (BPSI): today’s Performance
| Last | Previous | Change | |
| BPSI | 27.52 | 27.52 | 0.00% |
| Volume | |||
| Value |
Lebanese Stocks: today’s Trades and Closing Prices
| Last Price ($) | % Change | Volume | VWAP ($) | |
| Solidere A | 106.30 | -1.39% | 6,726 | 106.30 |
| Solidere B | 108.10 | -2.35% | 603 | 108.15 |
| BLOM – Listed Shares | 6.60 | 10.00% | 1,000 | 6.60 |
Closing Date: February 18, 2025
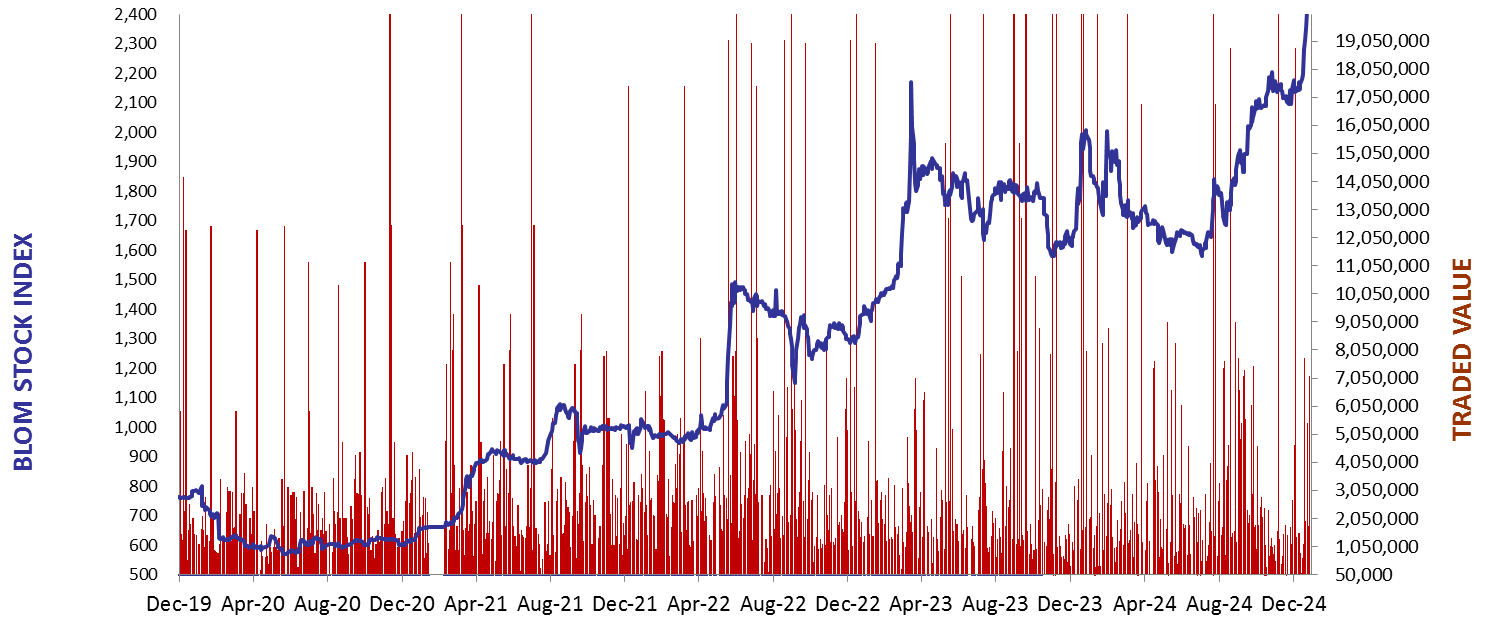
The BLOM Stock Index
BLOM BOND INDEX: Last Session’s Performance
| Last | Previous | Change | Y-t-D Change | ||
| BBI | 19.07 | 18.98 | 0.48% | 43.47% | |
| Weighted Yield | 84.37% | 84.34% | 2 | bps | |
| Duration (Years) | 2.32 | 2.33 | |||
| 5Y Bond Yield | 85.25% | 85.60% | -35 | bps | |
| 5Y Spread* | 8,092 | 8,121 | -29 | bps | |
| 10Y Bond Yield | 61.40% | 61.60% | -20 | bps | |
| 10Y Spread* | 5,693 | 5,708 | -15 | bps |
*spread between Lebanese Eurobonds and US Treasuries
| Price | Yield | Yield Change | |
| 28/11/2026 | 18.38 | 142.93% | 27 |
| 23/03/2027 | 18.44 | 121.10% | (8) |
| 29/11/2027 | 18.40 | 92.18% | (14) |
| 03/11/2028 | 18.45 | 71.81% | (35) |
| 26/02/2030 | 18.41 | 57.74% | (10) |
| 22/04/2031 | 18.35 | 51.99% | (37) |
| 23/03/2032 | 18.37 | 48.35% | (6) |
| 02/11/2035 | 18.40 | 41.44% | (14) |
| 23/03/2037 | 18.42 | 41.21% | (10) |
Closing Date: February 17, 2025
Lebanese Forex Market
| Last Price | Previous | % Change | |
| $/LBP | 89,500 | 89,500 | – |
| €/LBP | 93,652.80 | 93,831.80 | -0.19% |
| £/LBP | 112,787.90 | 112,993.75 | -0.18% |
| NEER | 234.88 | 234.79 | 0.04% |
Closing Date: February 18, 2025