
Discover today’s performance of BLOM indices, the closing prices of Lebanese stocks and Eurobonds, as well as the exchange rate of major currencies against the LBP.
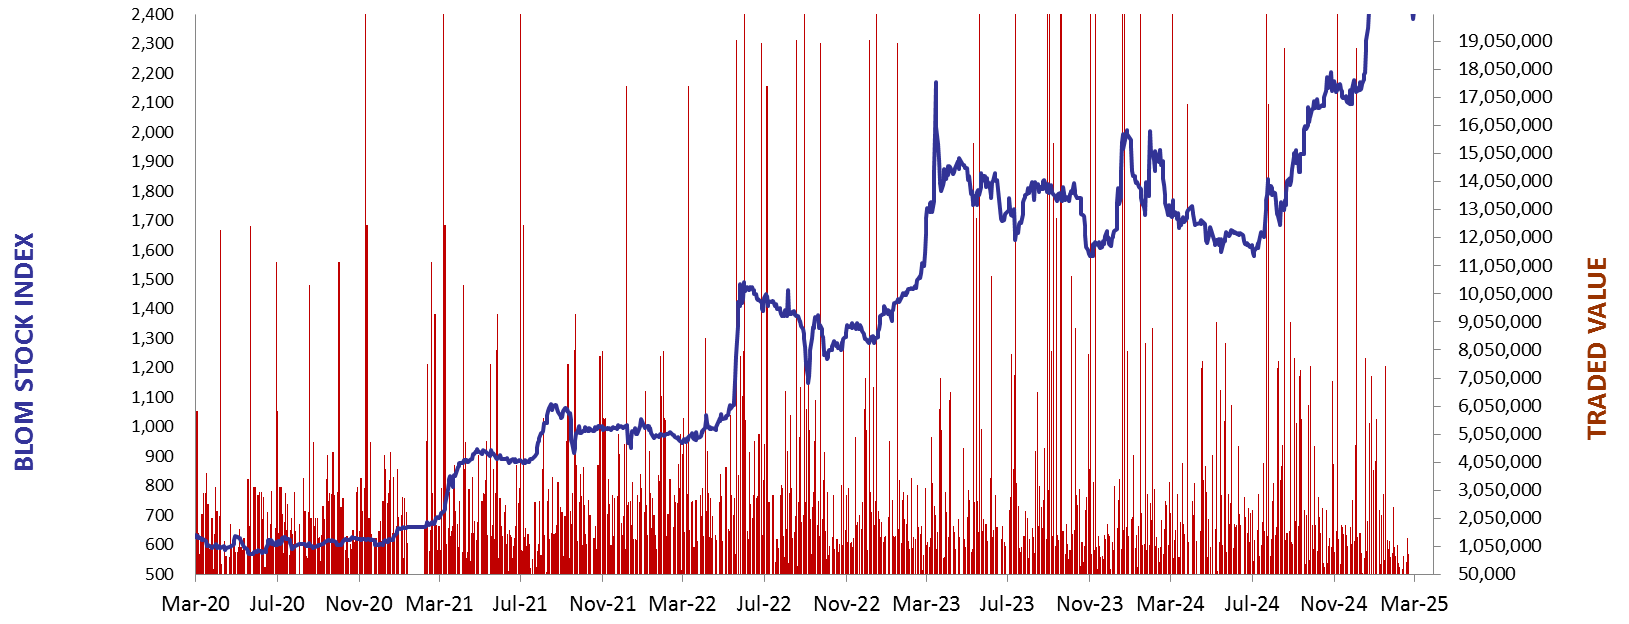
BLOM Stock Index (BSI) – today’s performance
| Last | Previous | % Change | Y-t-D Change | |
| BSI | 2,296.77 | 2,283.06 | 0.60% | -12.59% |
| Volume | 13,643 | 707,787 | ||
| Val ($) | 392,998 | 2,457,582 |
I): BLOM preferred Shares Index (BPSI): today’s Performance
| Last | Previous | Change | |
| BPSI | 27.52 | 27.52 | 0.00% |
| Volume | |||
| Value |
Lebanese Stocks: today’s Trades and Closing Prices
| Last Price ($) | % Change | Volume | |
| Solidere A | 95.80 | 1.32% | 3,022 |
| Solidere B | 99.55 | -0.25% | 321 |
| BLOM Bank GDR | 6.03 | 7.67% | 10,000 |
| Ciments Blancs (N) | 39.90 | 0.00% | 300 |
Closing Date: March 28, 2025
The BLOM Stock Index
BLOM BOND INDEX: Last Session’s Performance
| Last | Previous | Change | Y-t-D Change | ||
| BBI | 17.10 | 17.53 | -2.43% | 28.68% | |
| Weighted Yield | 95.57% | 93.77% | 179 | bps | |
| Duration (Years) | 2.31 | 2.34 | |||
| 5Y Bond Yield | 95.00% | 93.10% | 190 | bps | |
| 5Y Spread* | 9,091 | 8,902 | 189 | bps | |
| 10Y Bond Yield | 67.30% | 66.10% | 120 | bps | |
| 10Y Spread* | 6,292 | 6,175 | 117 | bps |
*spread between Lebanese Eurobonds and US Treasuries
| Price | Yield | Yield Change | |
| 28/11/2026 | 16.48 | 166.28% | 356 |
| 23/03/2027 | 16.51 | 139.30% | 200 |
| 29/11/2027 | 16.52 | 103.10% | 235 |
| 03/11/2028 | 16.49 | 79.55% | 123 |
| 26/02/2030 | 16.48 | 63.21% | 101 |
| 22/04/2031 | 16.57 | 56.60% | 90 |
| 23/03/2032 | 16.52 | 52.83% | 122 |
| 02/11/2035 | 16.57 | 45.41% | 73 |
| 23/03/2037 | 16.52 | 45.56% | 77 |
Closing Date: March 27, 2025
Lebanese Forex Market
| Last Price | Previous | % Change | |
| $/LBP | 89,500 | 89,500 | – |
| €/LBP | 96,534.70 | 96,668.95 | -0.14% |
| £/LBP | 115,830.90 | 115,893.55 | -0.05% |
| NEER | 237.17 | 237.07 | 0.04% |
Closing Date: March 28, 2025