
According to the Lebanese Customs Administration, Lebanon’s cumulative trade deficit increased by 5.55% year-over-year (YoY), reaching $3.42 billion by March 2025. This improvement was driven by a cumulative 30.92% YoY surge in exports by March 2025, which outpaced the cumulative 10.22% YoY rise in imports during the same period.
The sharp rise in exports likely signals a rebound in business activity across multiple regions following the November 27, 2024, ceasefire with Israel. While Israel has continued to breach the agreement, these disruptions have remained localized, allowing broader commercial operations to resume and drive export growth.
BLOM Lebanon’s Purchasing Managers’ (PMI) data for January and February 2025 supports this trend despite the slight decrease in March 2025. Notably, new export orders showed significant improvement, reaching a 14-month high in January and a 15-month high in February, though lower in March, suggesting strengthening external demand.
Additionally, consumer behavior adjusted as geopolitical tensions eased, with individuals spending more freely rather than limiting their consumption to stockpiling essentials, contributing to the rise in imports.
Lebanon’s Balance of Trade (USD Million)
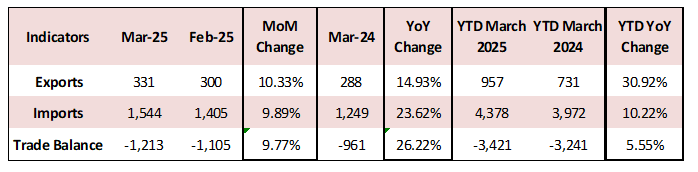
YTD: Year to Date
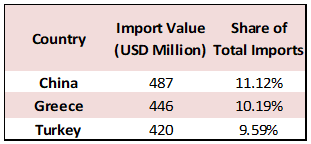
The top three import destinations in 2025 up till March were China, Greece, and Turkey, accounting for 11.12%, 10.19%, and 9.59% of the total value of imports, respectively. The top imported products were mineral products (28.71%) at $1.26 million, pearls, precious stones, and metals (11.99%) at $525 million, and products of the chemical or allied industries (8.59%) at $376 million.
Top Import Destinations for Lebanon (YTD up to Mar 2025)
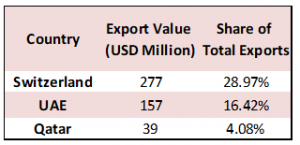
On the exports side, the top three destinations in 2025 up till March were Switzerland, United Arab Emirates (UAE) and Qatar capturing respective shares of 23.74%, 16.42% and 4.08% of the total value of exports. The top exported products were pearls, precious stones, and metals (43.26%) at $414 million, base metals and articles of base metal (14.73%) at $ 141 million, and prepared foodstuffs, beverages, and tobacco (10.34%) at $99 million.
Top Export Destinations for Lebanon (YTD up to Mar 2025)
Disclaimer:
This article is a research document that is owned and published by BLOMINVEST BANK SAL.
No material from this publication may be modified, copied, reproduced, repackaged, republished, circulated, transmitted or redistributed directly or indirectly, in whole or in any part, without the prior written authorization of BLOMINVEST BANK SAL.
The information and opinions contained in this document have been compiled from or arrived at in good faith from sources deemed reliable. Neither BLOMINVEST BANK SAL, nor any of its subsidiaries or affiliates or parent company will make any representation or warranty to the accuracy or completeness of the information contained herein.
Neither the information nor any opinion expressed in this research article constitutes an offer or a recommendation to buy or sell any assets or securities, or to provide investment advice.
This research article is prepared for general circulation and is circulated for general information only.