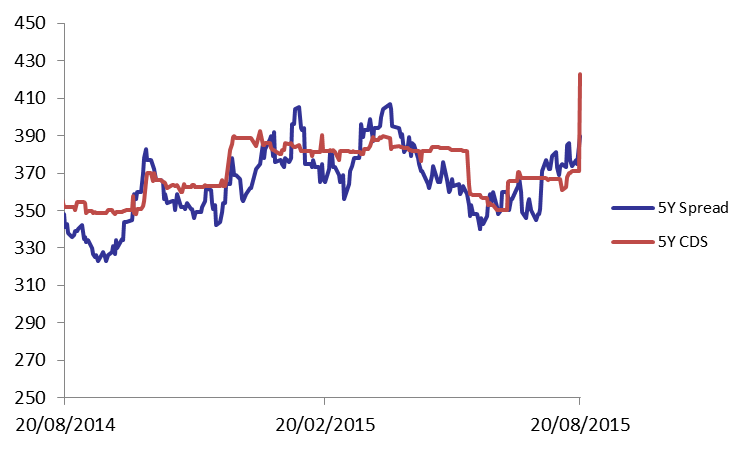
Demand on the Lebanese Eurobonds market weakened illustrated by numerous hikes throughout the yield curve. This was possibly due to the heightening tensions in Syria coupled with local disturbances on the political front. Accordingly, the BLOM Bond Index (BBI) went down by 0.38% to 106.802 points. The yields on the 5Y and 10Y Lebanese Eurobonds increased by 5 basis points (bps) and 9 bps to reach respective levels of 5.40% and 6.29%. The 5Y spread between Lebanese Eurobonds and their US equivalent broadened by 5 bps to 390 bps as demand for medium term US notes remained stable. The Lebanese 5Y Credit Default Swaps (CDS) broadened from their previous quotes of 358-383 bps to 403-443 bps.
| Last | Previous | Change | Y-t-D Change | ||
| BBI | 106.802 | 107.208 | -0.38% | -0.62% | |
| Weighted Yield | 5.52% | 5.46% | 6 | bps | |
| Duration (Years) | 5.03 | 5.04 | |||
| 5Y Bond Yield | 5.40% | 5.35% | 5 | bps | |
| 5Y Spread* | 390 | 385 | 5 | bps | |
| 10Y Bond Yield | 6.29% | 6.20% | 9 | bps | |
| 10Y Spread* | 420 | 408 | 12 | bps | |
*Between Lebanese and U.S notes
| Price | Yield | Yield Change (in bps) | |
| Nov. 2016 | 100.85 | 4.01% | 1 |
| Mar. 2017 | 107.14 | 4.28% | 2 |
| Oct. 2017 | 101.1 | 4.45% | 0 |
| Jun. 2018 | 101.42 | 4.60% | 0 |
| Nov. 2018 | 101.16 | 4.76% | 0 |
| Apr. 2019 | 101.25 | 5.12% | 4 |
| Mar. 2020 | 103.5 | 5.49% | 12 |
| Apr. 2020 | 101.25 | 5.49% | 9 |
| Apr. 2021 | 112.5 | 5.63% | 10 |
| Oct. 2022 | 101.5 | 5.84% | 7 |
| Jan. 2023 | 100.75 | 5.87% | 4 |
| Dec. 2024 | 106.5 | 6.07% | 7 |
| Feb. 2025 | 100.63 | 6.11% | 7 |
| Nov. 2026 | 102 | 6.35% | 12 |
| Nov. 2027 | 103 | 6.39% | 12 |
| Feb. 2030 | 101.5 | 6.49% | 8 |