
Discover today’s performance of BLOM indices, the closing prices of Lebanese stocks and Eurobonds, as well as the exchange rate of major currencies against the LBP.
BLOM Stock Index (BSI): Today’s Performance
| Last | Previous | % Change | Y-t-D Change | |
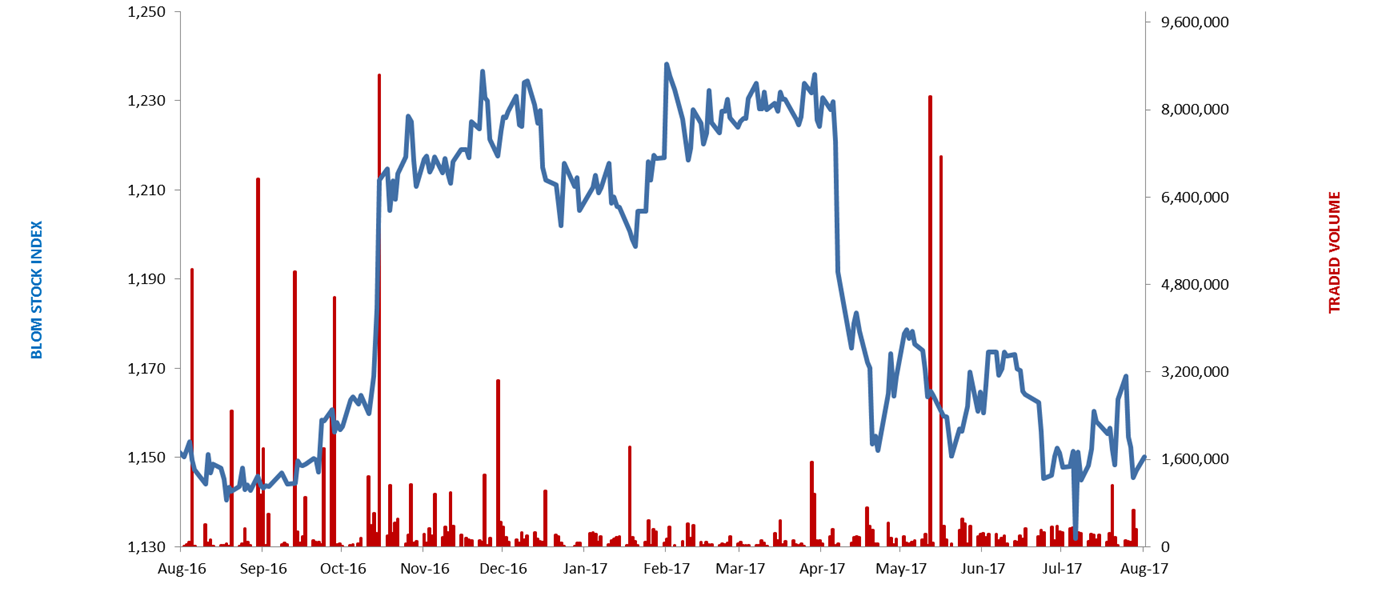
| BSI | 1,146.01 | 1,146.85 | -0.07% | -5.50% |
| High | 1,146.03 | 1,148.04 | ||
| Low | 1,143.22 | 1,144.17 | ||
| Volume | 98,947 | 322,447 | -69.31% | |
| Val ($) | 819,544 | 1,677,098 | -51.13% |
BLOM Preferred Shares Index (BPSI): Today’s Performance
| Last | Previous | Change | |
| BPSI | 105.03 | 105.02 | 0.01% |
| Volume | 2,200 | – | |
| Value | 70,660 | – |
Lebanese Stocks: Today’s Trades and Closing Prices
| Last Price ($) | % Change | Volume | VWAP ($) | |
| Solidere A | 7.88 | 0.38% | 13,280 | 7.87 |
| Solidere B | 7.75 | 0.13% | 45,300 | 7.74 |
| Bank Audi | 6 | – | 5,500 | 6 |
| Bank Audi GDR | 6 | -1.48% | 16,800 | 6 |
| Bank Audi Pref G | 100.3 | – | 200 | 100.3 |
| BoB Pref J | 25.3 | 20.00% | 2,000 | 25.3 |
| Byblos Bank – Listed | 1.6 | – | 2,667 | 1.6 |
| Blom – Listed Shares | 11.35 | – | 7,800 | 11.35 |
| BLOM GDR | 12.4 | – | 5,400 | 12.4 |
The BLOM Stock Index
Lebanese Global Depository Receipts: Last session’s Performance
| GDRs | Last Price ($) | Previous Price ($) | % Change | Volume | Value ($) |
| BLOM GDR | 12.25 | 12.25 | 0.0% | 39,189 | 481,474 |
| Audi GDR | 6 | 6.01 | -0.2% | 67,893 | 407,358 |
| Byblos GDR | 80 | 80 | 0.0% | – | – |
Source: London Stock Exchange
Closing Date: 07 Aug 2017
BLOM BOND INDEX: Last Session’s Performance
| Last | Previous | Change | Y-t-D Change | ||
| BBI | 104.57 | 104.67 | -0.10% | 2.62% | |
| Weighted Yield | 6.202% | 6.182% | 2 | bps | |
| Duration (Years) | 5.16 | 5.17 | |||
| 5Y Bond Yield | 6.21% | 6.19% | 2 | bps | |
| 5Y Spread* | 339 | 437 | -98 | bps | |
| 10Y Bond Yield | 6.75% | 6.73% | 3 | bps | |
| 10Y Spread* | 348 | 446 | -98 | bps | |
*between Lebanese Eurobonds and US Treasuries
Closing Date: 7 August 2017
Lebanese Eurobonds: Last Sessions’ Prices and Yields
| Price | Yield | Yield Change | |
| 12/06/2018 | 100.50 | 4.53% | 0 |
| 12/11/2018 | 100.50 | 4.73% | 0 |
| 23/04/2019 | 100.15 | 5.40% | 0 |
| 20/05/2019 | 101.00 | 5.40% | 7 |
| 28/11/2019 | 99.88 | 5.50% | 6 |
| 09/03/2020 | 101.88 | 5.58% | 5 |
| 14/04/2020 | 100.25 | 5.69% | 0 |
| 19/06/2020 | 100.88 | 5.81% | 0 |
| 12/04/2021 | 107.38 | 5.98% | 0 |
| 04/10/2022 | 99.38 | 6.24% | 3 |
| 27/01/2023 | 98.63 | 6.30% | 3 |
| 22/04/2024 | 101.05 | 6.45% | 1 |
| 04/11/2024 | 98.88 | 6.44% | 0 |
| 03/12/2024 | 103.13 | 6.45% | 0 |
| 26/02/2025 | 98.38 | 6.47% | 2 |
| 12/06/2025 | 98.38 | 6.52% | 2 |
| 28/11/2026 | 99.75 | 6.63% | 4 |
| 23/03/2027 | 101.00 | 6.71% | 0 |
| 29/11/2027 | 99.75 | 6.78% | 3 |
| 03/11/2028 | 98.25 | 6.87% | 3 |
| 26/02/2030 | 98.63 | 6.81% | 1 |
| 22/04/2031 | 100.25 | 6.97% | 0 |
| 23/03/2032 | 100.13 | 6.98% | 0 |
| 02/11/2035 | 99.25 | 7.12% | 2 |
| 23/03/2037 | 100.00 | 7.25% | 2 |
| Last Price | Previous | % Change | Y-t-D | |
| $/LBP | 1,514.00 | 1,514.00 | – | |
| €/LBP | 1,780.36 | 1,778.85 | 0.08% | |
| £/LBP | 1,961.71 | 1,967.59 | -0.30% | |
| NEER | 111.93 | 112.03 | -0.09% | -5.47% |
Closing Date: 8 August 2017