Discover today’s performance of BLOM indices, the closing prices of Lebanese stocks and Eurobonds, as well as the exchange rate of major currencies against the LBP.
BLOM Stock Index (BSI) – Today’s performance
| Last | Previous | % Change | Y-t-D Change | |
| BSI | 710.07 | 704.29 | 0.82% | -9.61% |
| High | 711.20 | 705.10 | ||
| Low | 708.90 | 694.50 | ||
| Volume | 77,043 | 62,762 | ||
| Val ($) | 642,254 | 521,132 |
I): BLOM preferred Shares Index (BPSI): today’s Performance
| Last | Previous | Change | |
| BPSI | 74.67 | 74.67 | 0.00% |
| Volume | 6,000 | – | |
| Value | 150,000 | – |
Lebanese Stocks: today’s Trades and Closing Prices
| Last Price ($) | % Change | Volume | VWAP ($) | |
| Solidere A | 8.58 | 0.82% | 341,244 | 8.58 |
| Solidere B | 8.43 | -0.82% | 132,807 | 8.43 |
| Bank Audi | 2.08 | 1.46% | 1,164 | 2.08 |
| Bank Audi – GDR | 2.39 | 16.02% | 239 | 2.39 |
| BOB – Pref H | 25.00 | 0.00% | 120,000 | 25.00 |
| BOB – Pref I | 25.00 | 0.00% | 30,000 | 25.00 |
| Bemo- Listed shares | 1.20 | 4.35% | 16,800 | 1.20 |
Closing Date: 03 February 2020
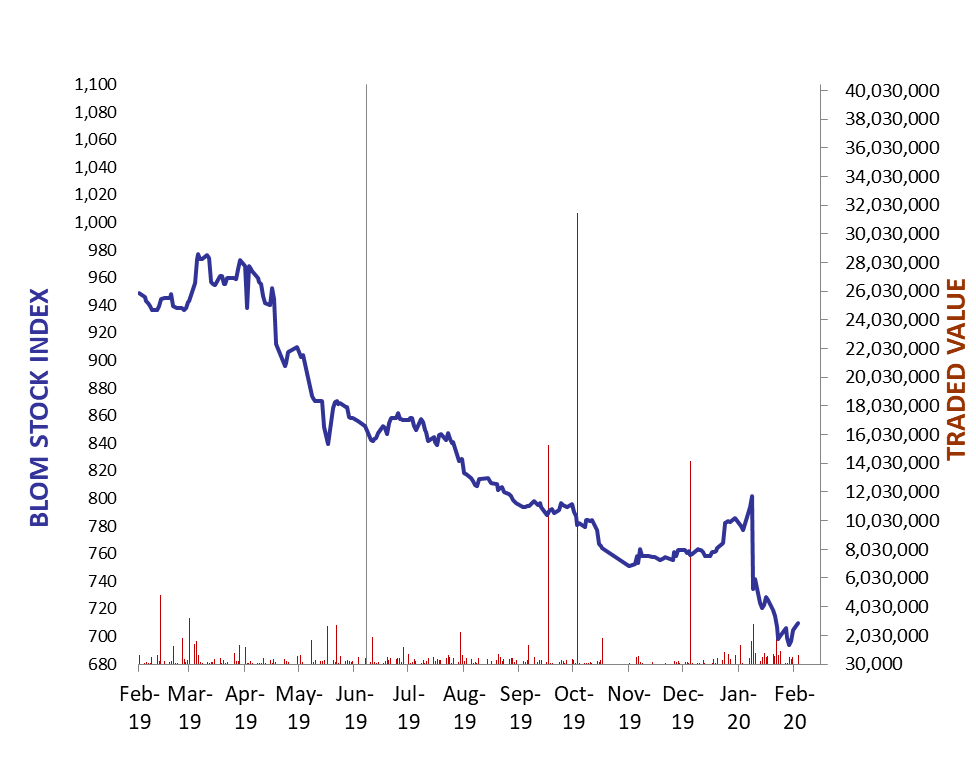
The BLOM Stock Index
Lebanese Global Depository Receipts: Last Session’s Performance
| GDRs | Last Price ($) | Previous Price ($) | % Change | Volume | Value ($) |
| BLOM GDR | 2.50 | 2.50 | 0.00% | – | – |
| Audi GDR | 1.4 | 1.4 | 0.00% | – | – |
| Byblos GDR | 70 | 70 | 0.00% | – | – |
Closing Date: 31 January 2020
Source: London Stock Exchange
BLOM BOND INDEX: Last Session’s Performance
| Last | Previous | Change | Y-t-D Change | ||
| BBI | 41.91 | 41.47 | 1.05% | -17.19% | |
| Weighted Yield | 38.22% | 38.45% | -23 | bps | |
| Duration (Years) | 3.78 | 3.75 | |||
| 5Y Bond Yield | 46.80% | 47.50% | -70 | bps | |
| 5Y Spread* | 4,550 | 4,613 | -63 | bps | |
| 10Y Bond Yield | 26.38% | 26.40% | -2 | bps | |
| 10Y Spread* | 2,496 | 2,491 | 5 | bps | |
*between Lebanese Eurobonds and US Treasuries
SClosing Date: 31 January 2020
Lebanese Eurobonds: Last Sessions’ Prices and Yields
| Price | Yield | Yield Change | |
| 12/04/2021 | 46.84 | 88.59% | 21 |
| 04/10/2022 | 39.69 | 48.76% | -20 |
| 27/01/2023 | 38.68 | 45.54% | -4 |
| 22/04/2024 | 37.48 | 37.02% | -35 |
| 04/11/2024 | 37.67 | 33.20% | -41 |
| 03/12/2024 | 37.43 | 34.54% | -48 |
| 26/02/2025 | 37.45 | 31.88% | -34 |
| 12/06/2025 | 37.89 | 30.47% | -17 |
| 28/11/2026 | 36.74 | 27.72% | -11 |
| 23/03/2027 | 37.24 | 27.22% | -31 |
| 29/11/2027 | 36.67 | 26.13% | 4 |
| 03/11/2028 | 36.66 | 24.58% | -53 |
| 26/02/2030 | 36.11 | 23.42% | -41 |
| 22/04/2031 | 36.04 | 23.29% | -42 |
| 23/03/2032 | 36.27 | 22.51% | -58 |
| 02/11/2035 | 36.35 | 21.05% | -51 |
| 23/03/2037 | 36.45 | 21.12% | -57 |
Lebanese Forex Market
| Last Price | Previous | % Change | Y-t-D | |
| $/LBP | 1,514.25 | 1,514.25 | – | |
| €/LBP | 1,665.79 | 1,672.27 | -0.39% | |
| £/LBP | 1,963.52 | 1,990.80 | -1.37% | |
| NEER | 118.67 | 118.66 | 0.01% |
Closing Date: 03 February 2020