Discover today’s performance of BLOM indices, the closing prices of Lebanese stocks and Eurobonds, as well as the exchange rate of major currencies against the LBP.
BLOM Stock Index (BSI) – Today’s performance
| Last | Previous | % Change | Y-t-D Change | |
| BSI | 618.93 | 618.72 | 0.03% | -21.21% |
| High | 624.70 | 619.20 | ||
| Low | 614.80 | 617.80 | ||
| Volume | 49,210 | 69,872 | ||
| Val ($) | 401,374 | 547,669 |
I): BLOM preferred Shares Index (BPSI): today’s Performance
| Last | Previous | Change | |
| BPSI | 66.67 | 66.67 | 0.00% |
| Volume | 168 | ||
| Value | 8,685 |
Lebanese Stocks: today’s Trades and Closing Prices
| Last Price ($) | % Change | Volume | VWAP ($) | |
| Solidere A | 8.54 | -0.70% | 45,565 | 8.5 |
| Solidere B | 8.51 | 0.71% | 636 | 8.5 |
| Byblos Bank – Listed Shares | 1.00 | -8.26% | 1,099 | 1.00 |
| Blom Listed shares | 3.68 | 7.92% | 1,900 | 3.70 |
| BLOM GDR | 3.04 | -1.30% | 10 | 3.00 |
Closing Date: 17 February 2020
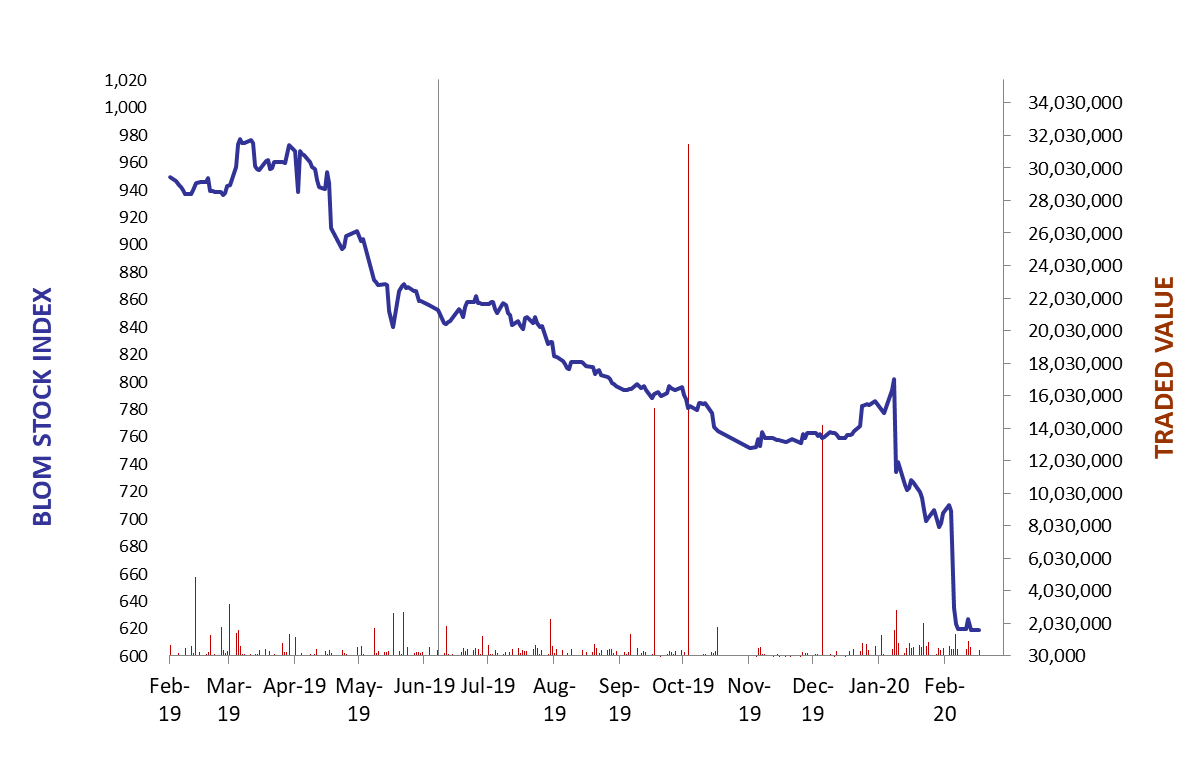
The BLOM Stock Index
Lebanese Global Depository Receipts: Last Session’s Performance
| GDRs | Last Price ($) | Previous Price ($) | % Change | Volume | Value ($) |
| BLOM GDR | 2.50 | 2.56 | -2.34% | ||
| Audi GDR | 1.4 | 1.4 | 0.00% | ||
| Byblos GDR | 70 | 70 | 0.00% | – | – |
Closing Date: 13, February 2020
Source: London Stock Exchange
BLOM BOND INDEX: Last Session’s Performance
| Last | Previous | Change | Y-t-D Change | ||
| BBI | 36.26 | 35.68 | 1.63% | -28.35% | |
| Weighted Yield | 45.63% | 46.00% | -37 | bps | |
| Duration (Years) | 3.54 | 3.52 | |||
| 5Y Bond Yield | 55.80% | 57.00% | -120 | bps | |
| 5Y Spread* | 5,438 | 5,558 | -120 | bps | |
| 10Y Bond Yield | 29.70% | 30.02% | -32 | bps | |
| 10Y Spread* | 2,817 | 2,847 | -30 | bps | |
*between Lebanese Eurobonds and US Treasuries
Closing Date: 13 February 2020
Lebanese Eurobonds: Last Sessions’ Prices and Yields
| Price | Yield | Yield Change | |
| 4/12/2021 | 38.75 | 116.70% | 120 |
| 10/4/2022 | 34.22 | 57.26% | -89 |
| 1/27/2023 | 33.02 | 53.60% | -79 |
| 4/22/2024 | 32.76 | 42.09% | -44 |
| 11/4/2024 | 32.84 | 37.76% | -48 |
| 12/3/2024 | 32.42 | 39.43% | -60 |
| 2/26/2025 | 32.65 | 36.22% | -126 |
| 6/12/2025 | 33.29 | 34.35% | -77 |
| 11/28/2026 | 32.11 | 31.21% | -96 |
| 3/23/2027 | 32.29 | 30.86% | -43 |
| 11/29/2027 | 31.82 | 29.56% | -68 |
| 11/3/2028 | 31.91 | 27.72% | -31 |
| 2/26/2030 | 32.16 | 25.89% | -29 |
| 4/22/2031 | 31.76 | 25.99% | -2 |
| 3/23/2032 | 31.88 | 25.19% | -31 |
| 11/2/2035 | 32.09 | 23.53% | -24 |
| 3/23/2037 | 31.96 | 23.80% | -31 |
Lebanese Forex Market
| Last Price | Previous | % Change | Y-t-D | |
| $/LBP | 1,514.25 | 1,514.25 | – | |
| €/LBP | 1,633.83 | 1,632.77 | 0.06% | |
| £/LBP | 1,961.56 | 1,966.84 | -0.27% | |
| NEER | 119.53 | 119.41 | 0.10% |
Closing Date: 17 February 2020