
Discover today’s performance of BLOM indices, the closing prices of Lebanese stocks and Eurobonds, as well as the exchange rate of major currencies against the LBP.
BLOM Stock Index (BSI) – today’s performance
| Last | Previous | % Change | Y-t-D Change | |
| BSI | 1,656.73 | 1,660.37 | -0.22% | -16.03% |
| High | 1,660.37 | 1,665.60 | ||
| Low | 1,642.44 | 1,660.10 | ||
| Volume | 21,159 | 10,014 | ||
| Val ($) | 405,613 | 163,731 |
I): BLOM preferred Shares Index (BPSI): today’s Performance
| Last | Previous | Change | |
| BPSI | 35.15 | 35.15 | 0.00% |
| Volume | |||
| Value |
Lebanese Stocks: today’s Trades and Closing Prices
| Last Price ($) | % Change | Volume | VWAP ($) | |
| Solidere A | 69.70 | -0.43% | 1,644 | 69.70 |
| Solidere B | 69.55 | -0.29% | 4,043 | 69.53 |
| Byblos Listed shares | 0.64 | 1.59% | 15,472 | 0.6 |
Closing Date: June 10, 2024
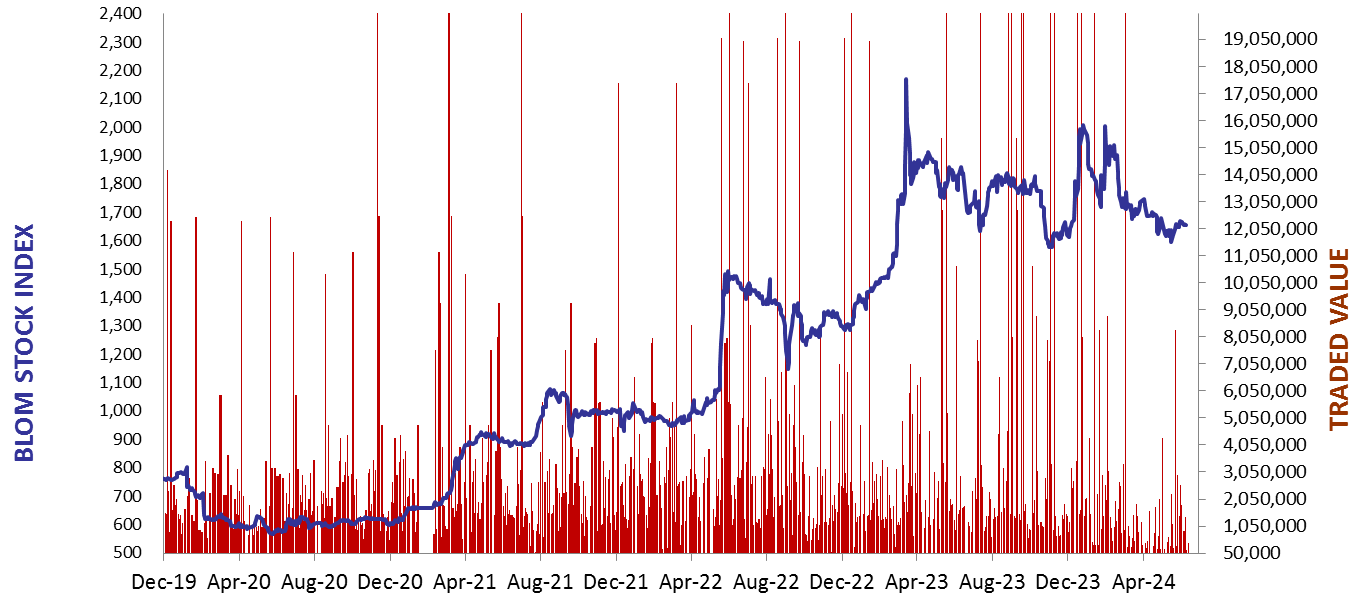
The BLOM Stock Index
BLOM BOND INDEX: Last Session’s Performance
| Last | Previous | Change | Y-t-D Change | ||
| BBI | 6.37 | 6.39 | -0.33% | 5.61% | |
| Weighted Yield | 242.84% | 241.46% | 137 | bps | |
| Duration (Years) | 1.46 | 1.46 | |||
| 5Y Bond Yield | 103.30% | 103.00% | 30 | bps | |
| 5Y Spread* | 9,813 | 9,792 | 21 | bps | |
| 10Y Bond Yield | 100.40% | 100.00% | 40 | bps | |
| 10Y Spread* | 9,575 | 9,551 | 24 | bps |
*spread between Lebanese Eurobonds and US Treasuries
| Price | Yield | Yield Change | |
| 26/02/2025 | 7.05 | 1047.76% | 881 |
| 12/06/2025 | 7.19 | 584.29% | 469 |
| 28/11/2026 | 7.06 | 188.52% | 15 |
| 23/03/2027 | 7.02 | 167.86% | 55 |
| 29/11/2027 | 7.02 | 141.70% | 58 |
| 03/11/2028 | 7.03 | 118.91% | 32 |
| 26/02/2030 | 7.03 | 103.65% | 40 |
| 22/04/2031 | 7.02 | 102.39% | 2 |
| 23/03/2032 | 7.03 | 99.59% | 49 |
| 02/11/2035 | 7.04 | 98.83% | (14) |
| 23/03/2037 | 7.04 | 100.52% | 40 |
Closing Date: June 07, 2024
Lebanese Forex Market
| Last Price | Previous | % Change | |
| $/LBP | 89,500 | 89,500 | – |
| €/LBP | 96,221.45 | 96,660.00 | -0.45% |
| £/LBP | 113,808.20 | 113,852.95 | -0.04% |
| NEER | 227.60 | 227.27 | 0.15% |
Closing Date: June 10, 2024