
Discover today’s performance of BLOM indices, the closing prices of Lebanese stocks and Eurobonds, as well as the exchange rate of major currencies against the LBP.
BLOM Stock Index (BSI) – today’s performance
| Last | Previous | % Change | Y-t-D Change | |
| BSI | 1,612.08 | 1,614.51 | -0.15% | -18.29% |
| High | 1,616.72 | 1,630.97 | ||
| Low | 1,611.58 | 1,612.72 | ||
| Volume | 22,694 | 28,681 | ||
| Val ($) | 1,567,696 | 1,573,586 |
I): BLOM preferred Shares Index (BPSI): today’s Performance
| Last | Previous | Change | |
| BPSI | 35.15 | 35.15 | 0.00% |
| Volume | |||
| Value |
Lebanese Stocks: today’s Trades and Closing Prices
| Last Price ($) | % Change | Volume | VWAP ($) | |
| Solidere A | 69.05 | -0.36% | 22,495 | 69.08 |
| Solidere B | 69.00 | 0.00% | 199 | 69.01 |
Closing Date: June 28, 2024
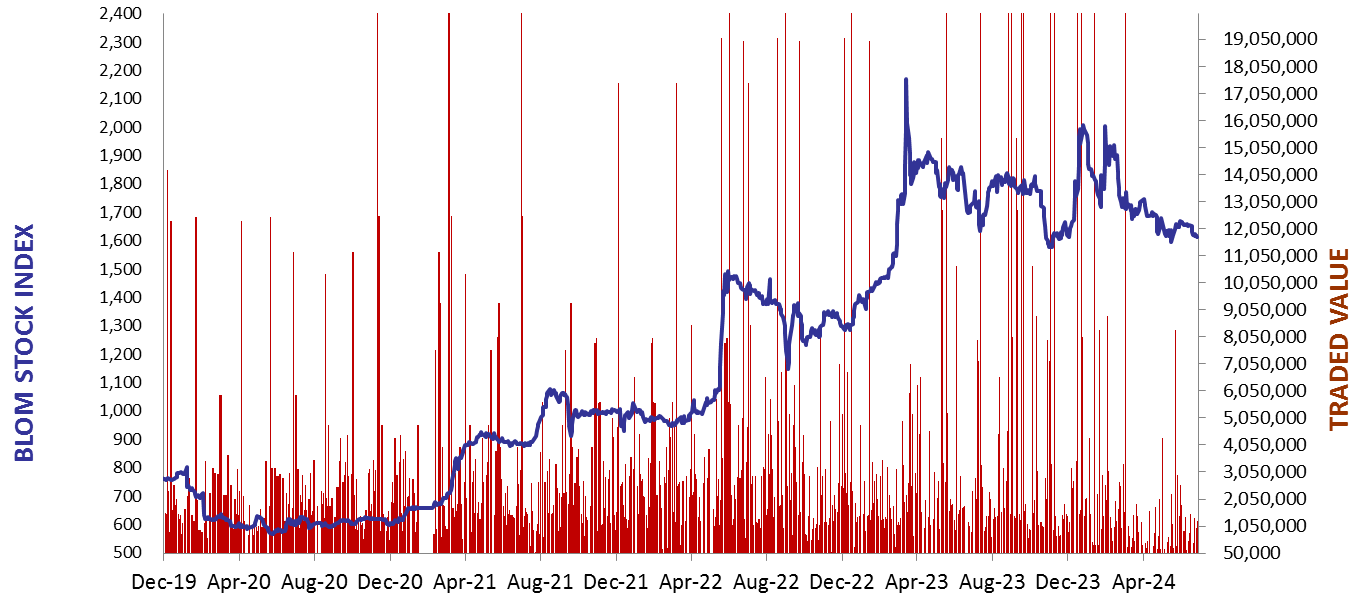
The BLOM Stock Index
BLOM BOND INDEX: Last Session’s Performance
| Last | Previous | Change | Y-t-D Change | ||
| BBI | 6.23 | 6.23 | 0.08% | 3.36% | |
| Weighted Yield | 267.40% | 266.23% | 117 | bps | |
| Duration (Years) | 1.40 | 1.40 | |||
| 5Y Bond Yield | 105.60% | 105.80% | -20 | bps | |
| 5Y Spread* | 10,050 | 10,067 | -17 | bps | |
| 10Y Bond Yield | 102.00% | 102.60% | -60 | bps | |
| 10Y Spread* | 9,751 | 9,807 | -56 | bps |
*spread between Lebanese Eurobonds and US Treasuries
Price | Yield | Yield Change | |
| 26/02/2025 | 6.88 | 1261.31% | 1,179 |
| 12/06/2025 | 7.10 | 644.29% | 320 |
| 28/11/2026 | 6.86 | 194.51% | 7 |
| 23/03/2027 | 6.89 | 172.48% | 24 |
| 29/11/2027 | 6.88 | 144.37% | 22 |
| 03/11/2028 | 6.87 | 121.05% | (31) |
| 26/02/2030 | 6.88 | 105.92% | 6 |
| 22/04/2031 | 6.86 | 104.23% | (80) |
| 23/03/2032 | 6.90 | 101.24% | (84) |
| 02/11/2035 | 6.90 | 100.21% | 3 |
| 23/03/2037 | 6.88 | 102.59% | 25 |
Closing Date: June 27, 2024
Lebanese Forex Market
| Last Price | Previous | % Change | |
| $/LBP | 89,500 | 89,500 | – |
| €/LBP | 95,729.20 | 95,782.90 | -0.06% |
| £/LBP | 113,092.20 | 113,110.10 | -0.02% |
| NEER | 228.26 | 228.07 | 0.08% |
Closing Date: June 28, 2024