
Discover today’s performance of BLOM indices, the closing prices of Lebanese stocks and Eurobonds, as well as the exchange rate of major currencies against the LBP.
BLOM Stock Index (BSI) – today’s performance
| Last | Previous | % Change | Y-t-D Change | |
| BSI | 1,614.71 | 1,618.61 | -0.24% | -18.16% |
| High | 1,619.92 | 1,619.92 | ||
| Low | 1,609.50 | 1,612.08 | ||
| Volume | 17,224 | 38,993 | ||
| Val ($) | 1,190,195 | 533,686 |
I): BLOM preferred Shares Index (BPSI): today’s Performance
| Last | Previous | Change | |
| BPSI | 35.15 | 35.15 | 0.00% |
| Volume | |||
| Value |
Lebanese Stocks: today’s Trades and Closing Prices
| Last Price ($) | % Change | Volume | VWAP ($) | |
| Solidere A | 69.15 | -0.58% | 17,184 | 69.10 |
| Solidere B | 69.00 | 0.00% | 40 | 69.00 |
Closing Date: July 02, 2024
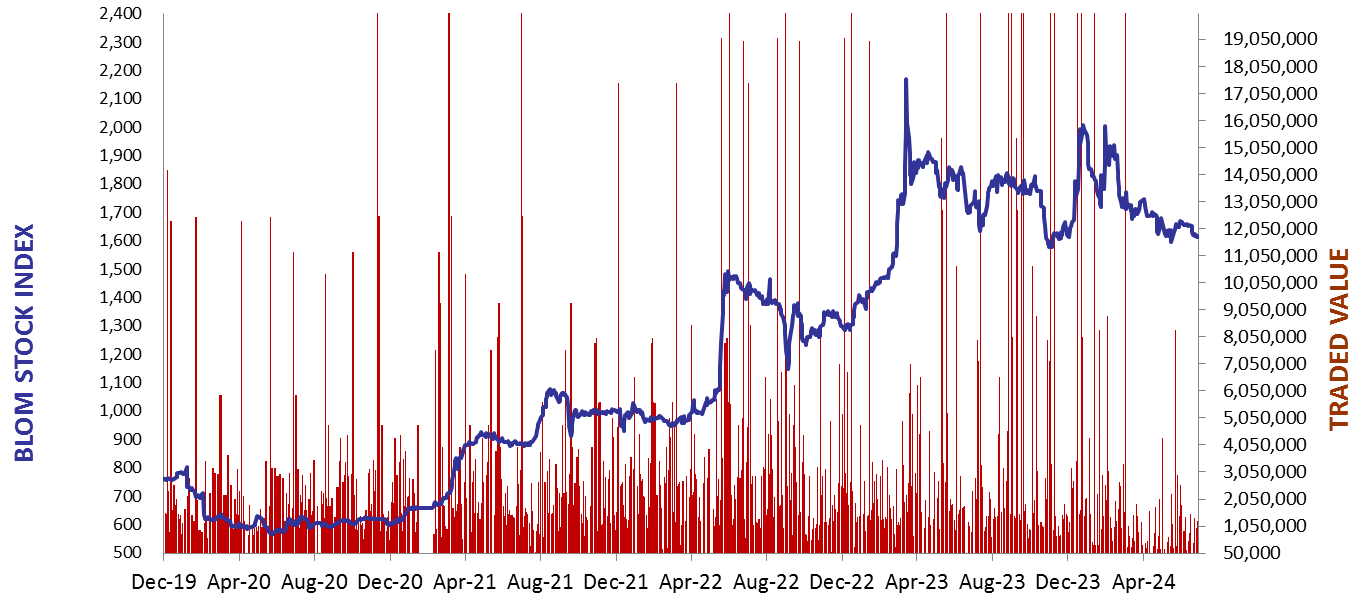
The BLOM Stock Index
BLOM BOND INDEX: Last Session’s Performance
| Last | Previous | Change | Y-t-D Change | ||
| BBI | 6.18 | 6.21 | -0.46% | 2.49% | |
| Weighted Yield | 273.33% | 268.84% | 449 | bps | |
| Duration (Years) | 1.38 | 1.39 | |||
| 5Y Bond Yield | 105.90% | 105.65% | 25 | bps | |
| 5Y Spread* | 10,080 | 10,056 | 24 | bps | |
| 10Y Bond Yield | 103.20% | 102.15% | 105 | bps | |
| 10Y Spread* | 9,862 | 9,763 | 99 | bps |
*spread between Lebanese Eurobonds and US Treasuries
| Price | Yield | Yield Change | |
| 26/02/2025 | 6.87 | 1311.44% | 4,025 |
| 12/06/2025 | 7.09 | 655.92% | 872 |
| 28/11/2026 | 6.82 | 195.78% | 141 |
| 23/03/2027 | 6.79 | 174.57% | 31 |
| 29/11/2027 | 6.79 | 145.70% | 8 |
| 03/11/2028 | 6.82 | 121.75% | (1) |
| 26/02/2030 | 6.85 | 106.37% | 42 |
| 22/04/2031 | 6.78 | 105.15% | 69 |
| 23/03/2032 | 6.81 | 102.47% | 109 |
| 02/11/2035 | 6.81 | 101.36% | 98 |
| 23/03/2037 | 6.82 | 103.52% | 79 |
Closing Date: July 01, 2024
Lebanese Forex Market
| Last Price | Previous | % Change | |
| $/LBP | 89,500 | 89,500 | – |
| €/LBP | 95,926.10 | 96,105.10 | -0.19% |
| £/LBP | 112,966.90 | 113,190.65 | -0.20% |
| NEER | 227.75 | 227.73 | 0.01% |
Closing Date: July 02, 2024