
Discover today’s performance of BLOM indices, the closing prices of Lebanese stocks and Eurobonds, as well as the exchange rate of major currencies against the LBP.
BLOM Stock Index (BSI) – today’s performance
| Last | Previous | % Change | Y-t-D Change | |
| BSI | 1,940.82 | 1,926.65 | 0.74% | -1.63% |
| High | 1,954.62 | 1,935.14 | ||
| Low | 1,931.13 | 1,918.22 | ||
| Volume | 7,797 | 5,397 | ||
| Val ($) | 697,122 | 480,348 |
I): BLOM preferred Shares Index (BPSI): today’s Performance
| Last | Previous | Change | |
| BPSI | 27.78 | 27.78 | 0.00% |
| Volume | |||
| Value |
Lebanese Stocks: today’s Trades and Closing Prices
| Last Price ($) | % Change | Volume | VWAP ($) | |
| Solidere A | 90.05 | 0.28% | 7,517 | 90.01 |
| Solidere B | 86.85 | 2.18% | 120 | 86.83 |
| HOLCIM | 63.00 | 0.00% | 160 | 63.00 |
Closing Date: September 5, 2024
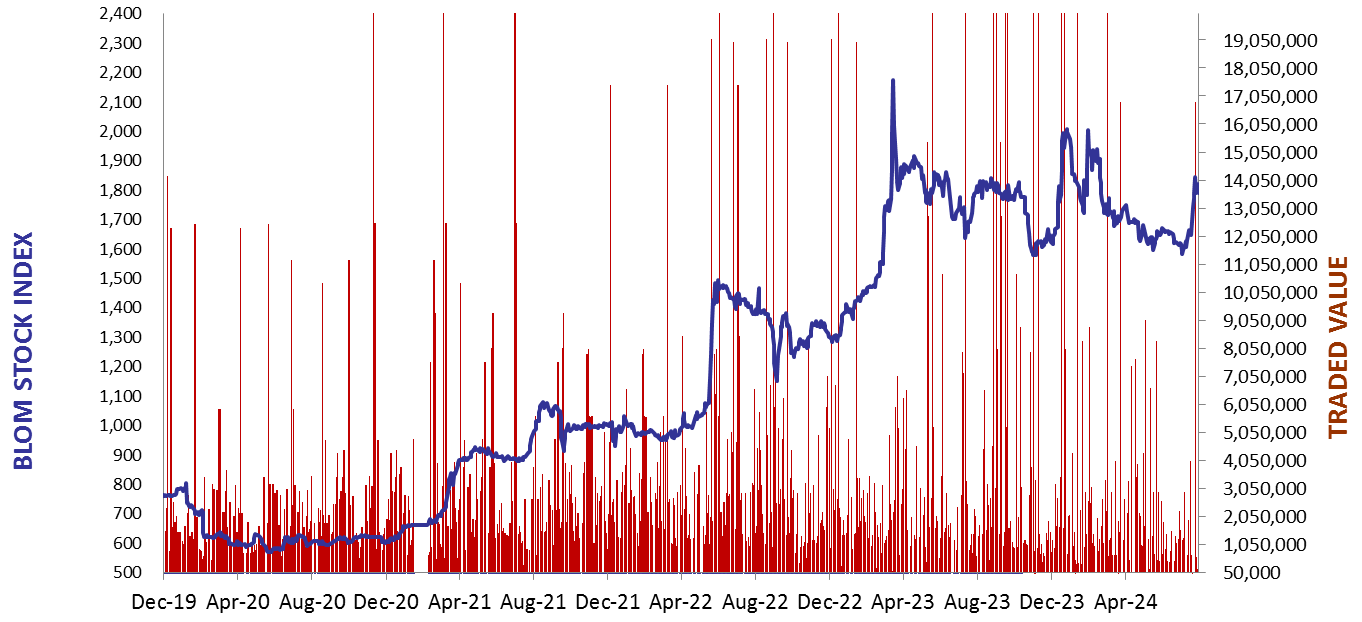
The BLOM Stock Index
BLOM BOND INDEX: Last Session’s Performance
| Last | Previous | Change | Y-t-D Change | ||
| BBI | 5.44 | 5.47 | -0.53% | -9.73% | |
| Weighted Yield | 218.41% | 217.26% | 115 | bps | |
| Duration (Years) | 1.29 | 1.30 | |||
| 5Y Bond Yield | 108.50% | 107.80% | 70 | bps | |
| 5Y Spread* | 10,427 | 10,345 | 82 | bps | |
| 10Y Bond Yield | 105.80% | 104.80% | 100 | bps | |
| 10Y Spread* | 10,217 | 10,107 | 110 | bps |
*spread between Lebanese Eurobonds and US Treasuries
| Price | Yield | Yield Change | |
| 12/06/2025 | 6.65 | 954.89% | 563 |
| 28/11/2026 | 6.54 | 214.16% | 74 |
| 23/03/2027 | 6.53 | 192.46% | 88 |
| 29/11/2027 | 6.53 | 153.78% | 43 |
| 03/11/2028 | 6.54 | 128.18% | 7 |
| 26/02/2030 | 6.54 | 113.10% | 2 |
| 22/04/2031 | 6.54 | 109.25% | 101 |
| 23/03/2032 | 6.55 | 107.85% | 132 |
| 02/11/2035 | 6.55 | 105.04% | 110 |
| 23/03/2037 | 6.52 | 109.82% | 136 |
Closing Date: September 4, 2024
Lebanese Forex Market
| Last Price | Previous | % Change | |
| $/LBP | 89,500 | 89,500 | – |
| €/LBP | 98,969.10 | 98,834.85 | 0.14% |
| £/LBP | 99,139.15 | 99,183.90 | -0.05% |
| NEER | 229.78 | 229.81 | -0.01% |
Closing Date: September 5, 2024