
Discover today’s performance of BLOM indices, the closing prices of Lebanese stocks and Eurobonds, as well as the exchange rate of major currencies against the LBP.
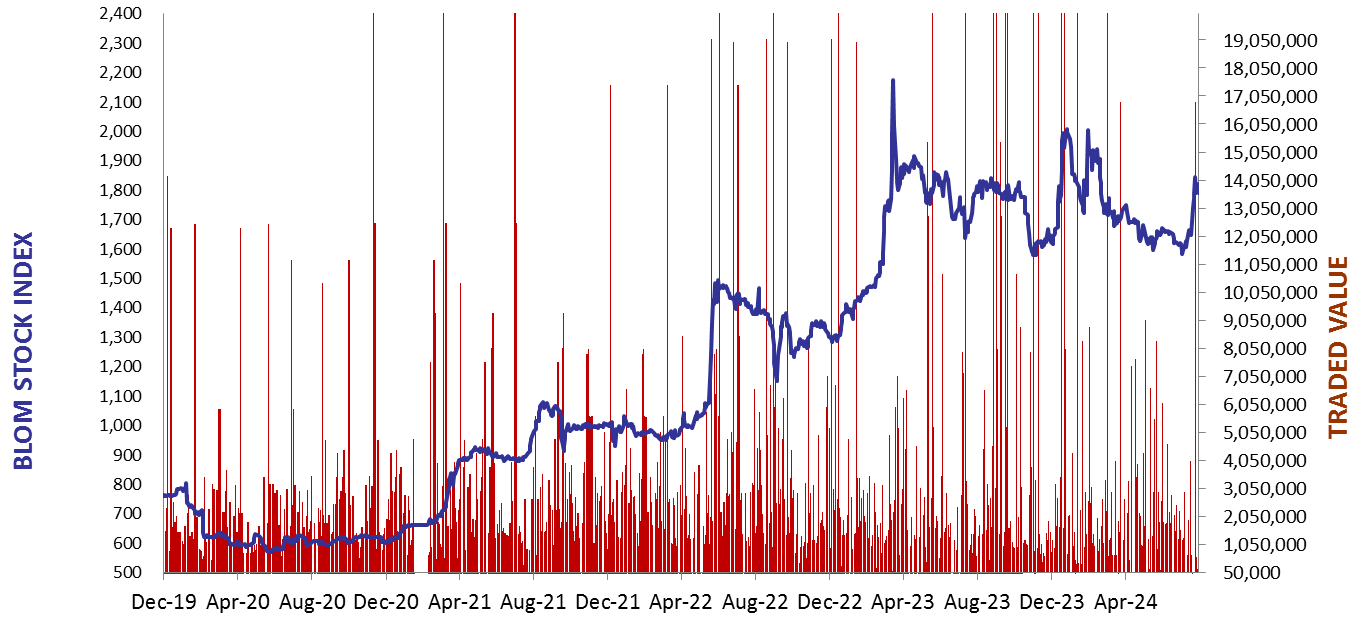
BLOM Stock Index (BSI) – today’s performance
| Last | Previous | % Change | Y-t-D Change | |
| BSI | 2,085.48 | 2,083.89 | 0.08% | 5.70% |
| High | 2,087.16 | 2,091.10 | ||
| Low | 2,082.68 | 2,076.16 | ||
| Volume | 535 | 89,122 | ||
| Val ($) | 49,709 | 2,434,366 |
I): BLOM preferred Shares Index (BPSI): today’s Performance
| Last | Previous | Change | |
| BPSI | 27.78 | 27.78 | 0.00% |
| Volume | |||
| Value |
Lebanese Stocks: today’s Trades and Closing Prices
| Last Price ($) | % Change | Volume | VWAP ($) | |
| Solidere A | 93.00 | 0.00% | 510 | 93.00 |
| Solidere B | 91.15 | 0.28% | 25 | 91.15 |
Closing Date: October 11, 2024
The BLOM Stock Index
BLOM BOND INDEX: Last Session’s Performance
| Last | Previous | Change | Y-t-D Change | ||
| BBI | 7.05 | 7.04 | 0.15% | 16.96% | |
| Weighted Yield | 206.21% | 205.78% | 43 | bps | |
| Duration (Years) | 1.57 | 1.58 | |||
| 5Y Bond Yield | 88.80% | 88.80% | 0 | bps | |
| 5Y Spread* | 8,458 | 8,456 | 2 | bps | |
| 10Y Bond Yield | 84.00% | 83.80% | 20 | bps | |
| 10Y Spread* | 8,012 | 7,991 | 21 | bps |
*spread between Lebanese Eurobonds and US Treasuries
| Price | Yield | Yield Change | |
| 12/06/2025 | 8.64 | 1025.87% | 510 |
| 28/11/2026 | 8.47 | 194.79% | 13 |
| 23/03/2027 | 8.49 | 171.81% | (15) |
| 29/11/2027 | 8.48 | 135.79% | (7) |
| 03/11/2028 | 8.47 | 111.25% | 13 |
| 26/02/2030 | 8.45 | 93.87% | 2 |
| 22/04/2031 | 8.46 | 89.94% | (29) |
| 23/03/2032 | 8.47 | 86.50% | (48) |
| 02/11/2035 | 8.46 | 83.05% | 18 |
| 23/03/2037 | 8.48 | 85.13% | 38 |
Closing Date: October 10, 2024
Lebanese Forex Market
| Last Price | Previous | % Change | |
| $/LBP | 89,500 | 89,500 | – |
| €/LBP | 97,859.30 | 97,868.25 | -0.01% |
| £/LBP | 116,770.65 | 116,869.10 | -0.08% |
| NEER | 230.75 | 230.52 | 0.10% |
Closing Date: October 11, 2024