
Discover today’s performance of BLOM indices, the closing prices of Lebanese stocks and Eurobonds, as well as the exchange rate of major currencies against the LBP.
BLOM Stock Index (BSI) – today’s performance
| Last | Previous | % Change | Y-t-D Change | |
| BSI | 2,144.12 | 2,164.61 | -0.95% | 8.67% |
| High | 2,172.16 | 2,188.18 | ||
| Low | 2,119.02 | 2,147.25 | ||
| Volume | 14,000 | 183,344 | ||
| Val ($) | 1,326,050 | 706,515 |
I): BLOM preferred Shares Index (BPSI): today’s Performance
| Last | Previous | Change | |
| BPSI | 27.78 | 27.78 | 0.00% |
| Volume | |||
| Value |
Lebanese Stocks: today’s Trades and Closing Prices
| Last Price ($) | % Change | Volume | VWAP ($) | |
| Solidere A | 95.00 | -0.84% | 9,000 | 95.12 |
| Solidere B | 94.00 | -2.08% | 5,000 | 94.00 |
Closing Date: November 12, 2024
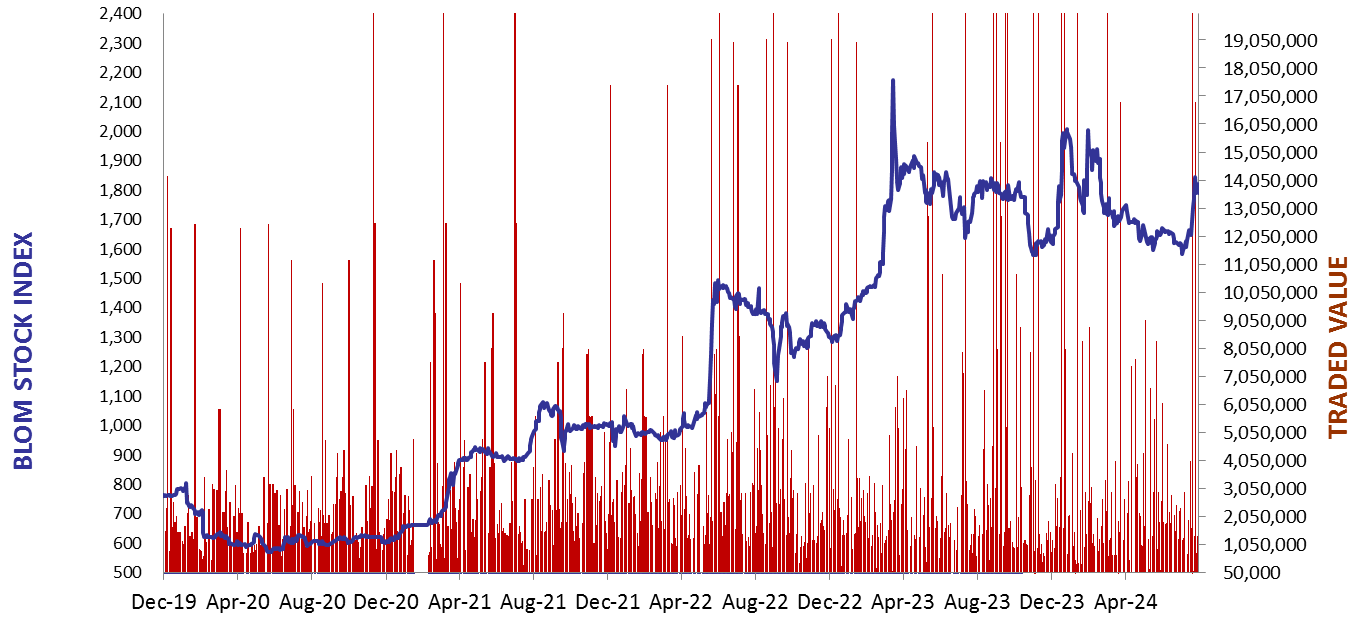
The BLOM Stock Index
BLOM BOND INDEX: Last Session’s Performance
| Last | Previous | Change | Y-t-D Change | ||
| BBI | 6.96 | 6.93 | 0.35% | 15.33% | |
| Weighted Yield | 244.41% | 240.43% | 398 | bps | |
| Duration (Years) | 1.54 | 1.55 | |||
| 5Y Bond Yield | 90.10% | 90.20% | -10 | bps | |
| 5Y Spread* | 8,578 | 8,588 | -10 | bps | |
| 10Y Bond Yield | 85.50% | 85.90% | -40 | bps | |
| 10Y Spread* | 8,132 | 8,172 | -40 | bps |
*spread between Lebanese Eurobonds and US Treasuries
| Price | Yield | Yield Change | |
| 12/06/2025 | 8.49 | 1416.99% | 4,596 |
| 28/11/2026 | 8.37 | 206.79% | 17 |
| 23/03/2027 | 8.32 | 178.64% | 10 |
| 29/11/2027 | 8.36 | 141.14% | 30 |
| 03/11/2028 | 8.36 | 114.43% | (7) |
| 26/02/2030 | 8.36 | 95.07% | (19) |
| 22/04/2031 | 8.29 | 91.69% | (12) |
| 23/03/2032 | 8.35 | 87.21% | (0) |
| 02/11/2035 | 8.33 | 84.80% | (36) |
| 23/03/2037 | 8.42 | 85.07% | (35) |
Closing Date: November 11, 2024
Lebanese Forex Market
| Last Price | Previous | % Change | |
| $/LBP | 89,500 | 89,500 | – |
| €/LBP | 95,004.25 | 95,353.30 | -0.37% |
| £/LBP | 114,712.15 | 115,177.55 | -0.40% |
| NEER | 231.74 | 231.40 | 0.14% |
Closing Date: November 12, 2024