The latest report published by the World Bank on Lebanon for Fall 2024 “Lebanon Economic Monitor – Mounting Burdens on a Crisis-Ridden Country” discussed the economic impact of the war on Lebanon. In this economic digest, we will shed light on a new and interesting approach to measure economic activity, namely “Night-Time Lights” (NTL).
Night-Time Lights data are collected in two ways. The first one is the US Air Defense Meteorological Satellite Program (DMSP) Operational Linescan System (OLS) starting in the 1970s. Since April 2012, a second generation of data became available, measured by the Day Night Band onboard the Polar Orbiting Satellite System, which is called “Visible Infrared Radiometer Suite (VIIRS). The VIIRS provides superior data than their predecessors since they offer high spatial accuracy, higher resolution, and temporally comparability. It is worth mentioning that both DMSP and VIIRS are beneficial in capturing informal economic activity in geographic or metropolitan areas with larger retail and services sector and inconvenient in rural areas or areas with low population density. World Bank’s statistical database allows them to predict the economic activity (GDP) of a country based on the below equations and for Lebanon, as the relation between the real GDP and NTL was examined using annual data for the period 2012 – 2020.
Zit = Yit + ɛzit’ (1)
Xit = βYit + ɛzit’ (2)
Where Yit is the growth in true real GDP, Zit is the growth of real GDP in the national accounts (measured with error “ɛzit’), Xit is the growth in observed light, and β is the elasticity of light with respect to income.
Since from (2):
Yit = Xit / β;
Therefore: Zit =1 / βXit + ɛzit’ (2’)
Based on the NTL approach, the economic activity for each of the 8 governorates relative to the total is as listed below:
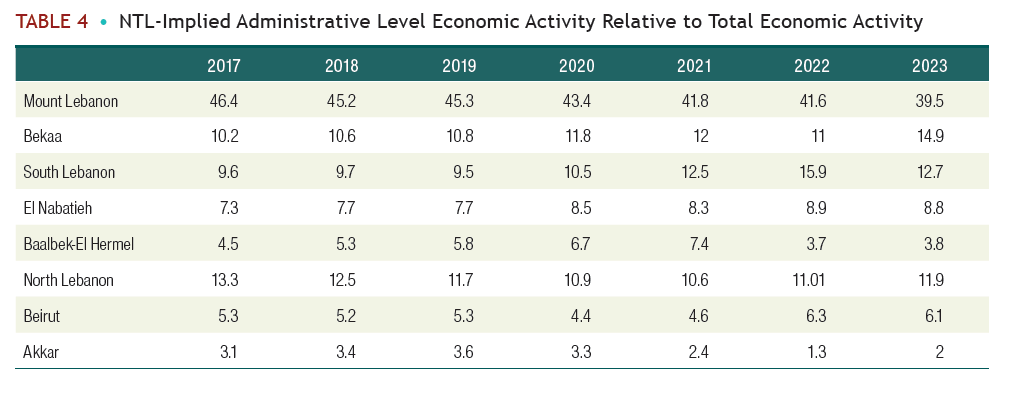
Source: World Bank
The critical escalation of the war in Lebanon caused mass internal displacement and destruction in many small and medium enterprises across five governorates – hence severely affecting economic activity in these governorates – being Mount Lebanon (Dahieh), South Lebanon, Nabatiyeh, Baalback – El Hermel, and the Bekaa.
As per World Bank estimates, β = %Δ NTL / %Δ GDP = 1.167, then %Δ GDP / %Δ NTL = 1/1.167 = 0.86, which is the inverse of β and captures the elasticity of GDP with respect to light. Therefore a 1% change in NTL results in a 0.86% change in GDP.
As such, given these estimations, $2.94 billion was the total shock to GDP (consumption) implied from NTLs for 2024 and the majority of it was in the fourth quarter upon the escalation of the war. Table below shows the shocks to consumption by governorate.
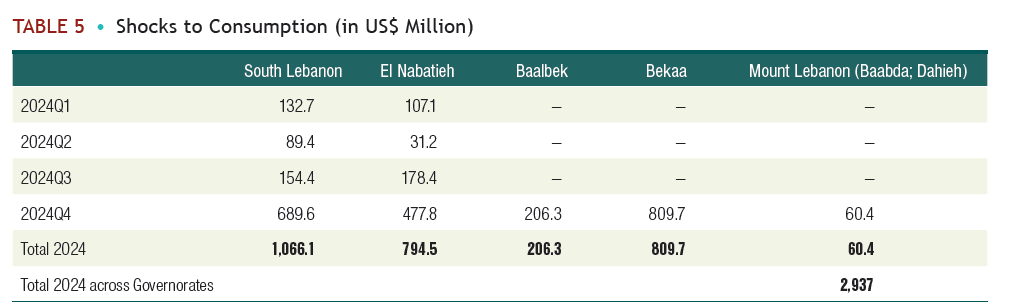
Also, as shown in the above table, shocks to Consumption in the first three quarters were relatively small and confined to South Lebanon and El Nabatiye governorates as the war was still on the southern border of Lebanon before escalating in late September 2024 and reaching Baalbek, Bekaa and Mount Lebanon (Dahieh). Moreover, the $2.94 billion represent 70% of the war losses estimated by the World Bank at $4.2 billion.
Disclaimer :
This article is a research document that is owned and published by Blominvest Bank SAL.
No material from this publication may be modified, copied, reproduced, repackaged, republished, circulated, transmitted or redistributed directly or indirectly, in whole or in any part, without the prior written authorization of Blominvest Bank SAL.
The information and opinions contained in this document have been compiled from or arrived at in good faith from sources deemed reliable. Neither Blominvest Bank SAL, nor any of its subsidiaries or affiliates or parent company will make any representation or warranty to the accuracy or completeness of the information contained herein.
Neither the information nor any opinion expressed in this research article constitutes an offer or a recommendation to buy or sell any assets or securities, or to provide investment advice.
This research article is prepared for general circulation and is circulated for general information only.