Appetite for Lebanese Eurobonds Faded on Monday
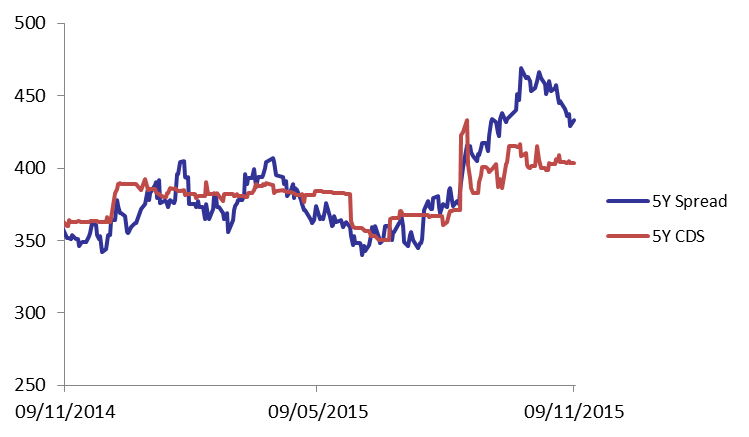
Demand on the Lebanese Eurobonds market weakened on Monday, illustrated by an upward shift of the yield curve. This caused the BLOM Bond Index (BBI) to drop by 0.18% to 104.39 points, broadening its year-to-date loss to 2.86%. Yields on the 5Y and 10Y Lebanese Eurobonds went up by 6 basis points (bps) and 3 bps to 6.08% and 6.57%, respectively. Demand for medium term maturities in the U.S. fell but at a slower pace than that of its Lebanese counterpart, leading the 5Y spread between both notes to broaden by 4 bps to 433 bps. As for the Lebanese 5Y Credit Default Swaps (CDS), they steadied at their previous quotes of 391-416 bps.
| Last | Previous | Change | Y-t-D Change | ||
| BBI | 104.392 | 104.584 | -0.184% | -2.86% | |
| Weighted Yield | 6.03% | 5.98% | 5 | bps | |
| Duration (Years) | 4.87 | 4.88 | |||
| 5Y Bond Yield | 6.08% | 6.02% | 6 | bps | |
| 5Y Spread* | 433 | 429 | 4 | bps | |
| 10Y Bond Yield | 6.57% | 6.54% | 3 | bps | |
| 10Y Spread* | 421 | 420 | 1 | bps | |
*Between Lebanese and U.S notes
| Price | Yield | Yield Change (in bps) | |
| Nov. 2016 | 100 | 4.75% | 25 |
| Mar. 2017 | 105.13 | 5.05% | 7 |
| Oct. 2017 | 99.75 | 5.14% | 0 |
| Jun. 2018 | 99.5 | 5.36% | 11 |
| Nov. 2018 | 99.25 | 5.42% | 9 |
| Apr. 2019 | 99.75 | 5.58% | 8 |
| May. 2019 | 101 | 5.68% | 0 |
| Nov.2019 | 98.5 | 5.87% | 7 |
| Mar. 2020 | 101.75 | 5.91% | 6 |
| Apr. 2020 | 99.5 | 5.93% | 7 |
| Apr. 2021 | 109.25 | 6.21% | 5 |
| Oct. 2022 | 99 | 6.28% | 5 |
| Jan. 2023 | 98.25 | 6.30% | 2 |
| Dec. 2024 | 103.88 | 6.43% | 0 |
| Feb. 2025 | 98.13 | 6.47% | 0 |
| Jun. 2025 | 98.13 | 6.51% | 0 |
| Nov. 2026 | 99.5 | 6.66% | 3 |
| Nov. 2027 | 100.25 | 6.72% | 3 |
| Feb. 2030 | 98 | 6.87% | 1 |