Discover today’s performance of BLOM indices, the closing prices of Lebanese stocks and Eurobonds, as well as the exchange rate of major currencies against the LBP.
BLOM Stock Index (BSI): Today’s Performance
| |
Last |
Previous |
% Change |
Y-t-D Change |
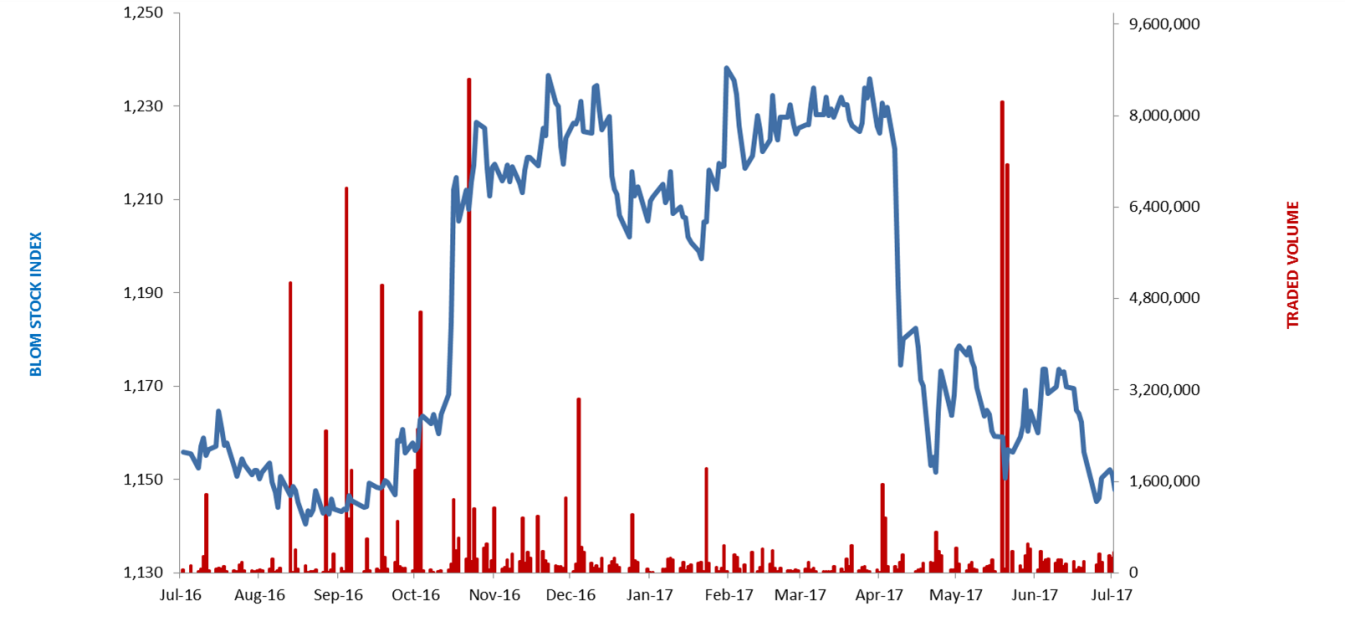
| BSI |
1,147.77 |
1,151.08 |
-0.29% |
-5.36% |
| High |
1,148.86 |
1,152.40 |
|
|
| Low |
1,147.54 |
1,146.35 |
|
|
| Volume |
110,421 |
359,837 |
-69.31% |
|
| Val ($) |
1,960,957 |
3,240,178 |
-39.48% |
|
BLOM Preferred Shares Index (BPSI): Today’s Performance
| |
Last |
Previous |
Change |
| BPSI |
104.66 |
104.68 |
-0.02% |
| Volume |
10,906 |
4,280 |
|
| Value |
1,102,727 |
356,433 |
|
Lebanese Stocks: Today’s Trades and Closing Prices
|
Last Price ($) |
% Change |
Volume |
VWAP ($) |
| Solidere A |
7.82 |
-0.51% |
11,198 |
7.84 |
| Solidere B |
7.60 |
-4.40% |
13,500 |
7.60 |
| Bank Audi Preferred I |
101.00 |
0.00% |
4,800 |
101.00 |
| Byblos Bank Listed |
1.63 |
0.00% |
20,262 |
1.63 |
| Byblos Bank Pref 2008 |
101.20 |
0.10% |
2,720 |
101.20 |
| Byblos Bank Pref 2009 |
101.20 |
-0.30% |
3,386 |
101.20 |
| BLOM Bank Listed |
11.20 |
0.00% |
30,500 |
11.20 |
| BLOM Bank GDR |
12.19 |
-0.08% |
24,055 |
12.19 |
The BLOM Stock Index
Lebanese Global Depository Receipts: Last session’s Performance
| GDRs |
Last Price ($) |
Previous Price ($) |
% Change |
Volume |
Value ($) |
| BLOM GDR |
11.95 |
12.1 |
-1.2% |
6,834 |
82,723 |
| Audi GDR |
6.1 |
6.01 |
1.5% |
10,000 |
61,000 |
| Byblos GDR |
80 |
80 |
0.0% |
– |
– |
Source: Reuters
Closing Date: 04 July 2017
BLOM BOND INDEX: Last Session’s Performance
| |
Last |
Previous |
Change |
Y-t-D Change |
| BBI |
104.60 |
104.71 |
-0.10% |
|
2.65% |
| Weighted Yield |
6.195% |
6.177% |
1.73 |
bps |
|
| Duration (Years) |
5.24 |
5.25 |
|
|
|
| 5Y Bond Yield |
6.10% |
6.04% |
6 |
bps |
|
| 5Y Spread* |
417 |
411 |
6 |
bps |
|
| 10Y Bond Yield |
6.77% |
6.77% |
0 |
bps |
|
| 10Y Spread* |
442 |
442 |
0 |
bps |
|
*between Lebanese Eurobonds and US Treasuries
Closing Date: 04 July 2017
Lebanese Eurobonds: Last Sessions’ Prices and Yields
| |
Price |
Yield |
Yield Change |
| 12/06/2018 |
100.38 |
4.73% |
0 |
| 12/11/2018 |
100.38 |
4.85% |
0 |
| 23/04/2019 |
100.50 |
5.20% |
0 |
| 20/05/2019 |
101.38 |
5.21% |
-1 |
| 28/11/2019 |
100.13 |
5.39% |
0 |
| 09/03/2020 |
101.75 |
5.66% |
0 |
| 14/04/2020 |
100.25 |
5.70% |
0 |
| 19/06/2020 |
101.00 |
5.78% |
0 |
| 12/04/2021 |
107.50 |
5.99% |
3 |
| 04/10/2022 |
99.88 |
6.12% |
5 |
| 27/01/2023 |
99.25 |
6.16% |
0 |
| 22/04/2024 |
101.25 |
6.42% |
5 |
| 04/11/2024 |
98.88 |
6.44% |
4 |
| 03/12/2024 |
103.13 |
6.46% |
4 |
| 26/02/2025 |
98.38 |
6.47% |
2 |
| 12/06/2025 |
98.50 |
6.49% |
0 |
| 28/11/2026 |
99.75 |
6.63% |
3 |
| 23/03/2027 |
100.50 |
6.78% |
0 |
| 29/11/2027 |
99.50 |
6.82% |
2 |
| 03/11/2028 |
98.25 |
6.87% |
1 |
| 26/02/2030 |
98.00 |
6.89% |
3 |
| 22/04/2031 |
100.25 |
6.97% |
0 |
| 23/03/2032 |
99.75 |
7.03% |
3 |
| 02/11/2035 |
99.63 |
7.09% |
2 |
| 23/03/2037 |
100.13 |
7.24% |
0 |
| |
Last Price |
Previous |
% Change |
Y-t-D |
| $/LBP |
1,514.00 |
1,514.00 |
– |
|
| €/LBP |
1,707.55 |
1,709.81 |
-0.13% |
|
| £/LBP |
1,947.09 |
1,947.09 |
– |
|
| NEER |
114.15 |
113.96 |
0.17% |
-3.59% |
Closing Date: 05 July 2017