Discover today’s performance of BLOM indices, the closing prices of Lebanese stocks and Eurobonds, as well as the exchange rate of major currencies against the LBP.
BLOM Stock Index (BSI) – today’s performance
| |
Last |
Previous |
% Change |
Y-t-D Change |
| BSI |
789.96 |
795.69 |
-0.72% |
-19.13% |
| High |
796.00 |
796.80 |
|
|
| Low |
788.90 |
793.80 |
|
` |
| Volume |
34,653 |
62,661 |
|
|
| Val ($) |
281,239 |
373,384 |
|
|
I): BLOM preferred Shares Index (BPSI): today’s Performance
| |
Last |
Previous |
Change |
| BPSI |
80.41 |
80.41 |
0.00% |
| Volume |
3,975 |
– |
|
| Value |
99,375 |
– |
|
Lebanese Stocks: today’s Trades and Closing Prices
| |
Last Price ($) |
% Change |
Volume |
VWAP ($) |
| Solidere A |
5.51 |
-5.49% |
23,347 |
5.73 |
| Solidere B |
5.57 |
-4.95% |
1,831 |
5.57 |
| Bank of Beirut Preferred J |
25 |
0.00% |
3,975 |
25 |
| BLOM GDR |
6.91 |
-1.00% |
5,500 |
6.91 |
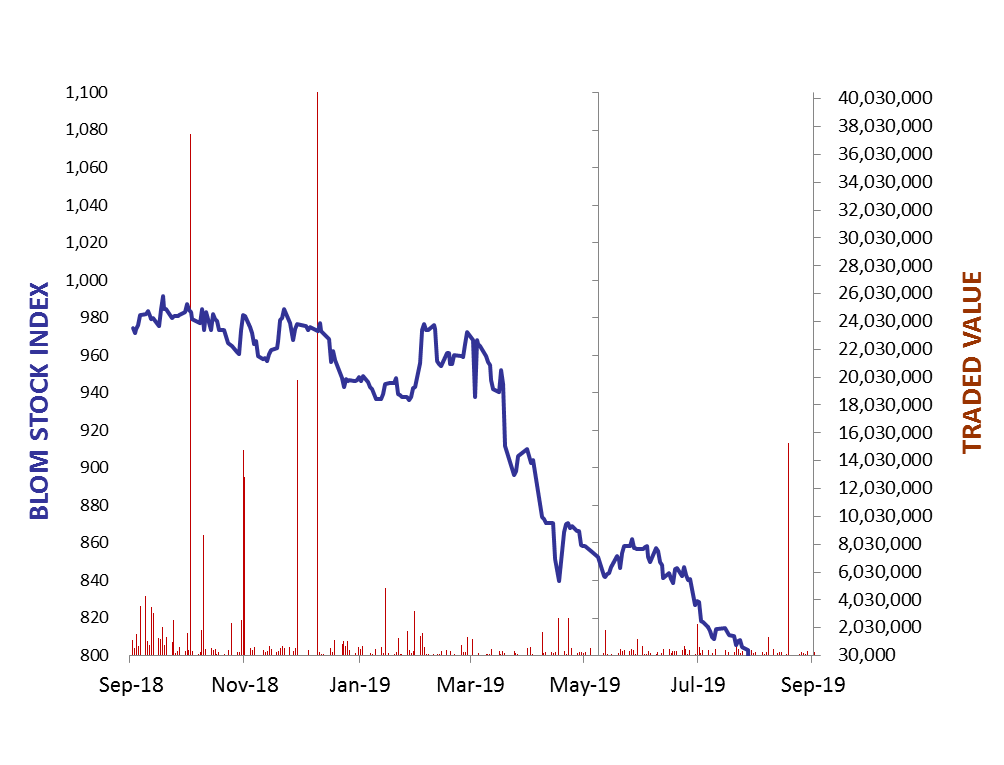
The BLOM Stock Index
Lebanese Global Depository Receipts: Last session’s Performance
| GDRs |
Last Price ($) |
Previous Price ($) |
% Change |
Volume |
Value ($) |
| BLOM GDR |
6.85 |
6.85 |
0.00% |
– |
– |
| Audi GDR |
3.82 |
3.82 |
0.00% |
– |
– |
| Byblos GDR |
70 |
70 |
0.00% |
– |
– |
Closing Date: 30 Sept. 2019
Source: London Stock Exchange
BLOM BOND INDEX: Last Session’s Performance
| |
Last |
Previous |
Change |
Y-t-D Change |
| BBI |
74.60 |
74.65 |
-0.07% |
|
-26.18% |
| Weighted Yield |
15.78% |
15.76% |
2 |
bps |
|
| Duration (Years) |
4.78 |
4.79 |
|
|
|
| 5Y Bond Yield |
19.10% |
18.90% |
20 |
bps |
|
| 5Y Spread* |
1,754 |
1,732 |
22 |
bps |
|
| 10Y Bond Yield |
14.21% |
14.22% |
-1 |
bps |
|
| 10Y Spread* |
1,259 |
1,260 |
-1 |
bps |
|
*between Lebanese Eurobonds and US Treasuries
Closing Date: 30 Sept. 2019
Lebanese Eurobonds: Last Sessions’ Prices and Yields
| |
Price |
Yield |
Yield Change |
| 12/04/2021 |
85.13 |
19.98% |
-22 |
| 04/10/2022 |
70.65 |
19.43% |
14 |
| 27/01/2023 |
69.29 |
18.83% |
20 |
| 22/04/2024 |
67.23 |
17.33% |
18 |
| 04/11/2024 |
66.04 |
16.32% |
27 |
| 03/12/2024 |
67.30 |
16.66% |
-3 |
| 26/02/2025 |
66.51 |
15.59% |
8 |
| 12/06/2025 |
66.89 |
15.11% |
2 |
| 28/11/2026 |
64.74 |
14.73% |
0 |
| 23/03/2027 |
64.79 |
14.78% |
-2 |
| 29/11/2027 |
64.67 |
14.19% |
-1 |
| 03/11/2028 |
64.79 |
13.48% |
-1 |
| 26/02/2030 |
64.83 |
12.88% |
1 |
| 22/04/2031 |
64.46 |
13.03% |
4 |
| 23/03/2032 |
64.84 |
12.68% |
4 |
| 02/11/2035 |
64.98 |
12.02% |
1 |
| 23/03/2037 |
64.98 |
12.12% |
1 |
Lebanese Forex Market
| |
Last Price |
Previous |
% Change |
Y-t-D |
| $/LBP |
1,514.25 |
1,514.25 |
– |
|
| €/LBP |
1,644.38 |
1,642.87 |
0.09% |
|
| £/LBP |
1,843.67 |
1,852.27 |
-0.46% |
|
| NEER |
119.63 |
119.44 |
0.16% |
|
Closing Date: 01 Oct. 2019